📄 Top Article 📄
Life by You - The new Sims Rival [...]
Author: Arshdeep Singh[ Source: GameTikker ]
⇄ Latest Gaming News ⇆
Weekly Special
The Elder Scrolls Online Anniversary
Read more...
Pick a Pocket to Claim the Thieves Guild DLC for Free & More
Tamriel’s stickiest fingers can claim the Thieves Guild DLC, a
special mount, and more during this new 10-Year Anniversary promotion!
[ Source: Steam ]
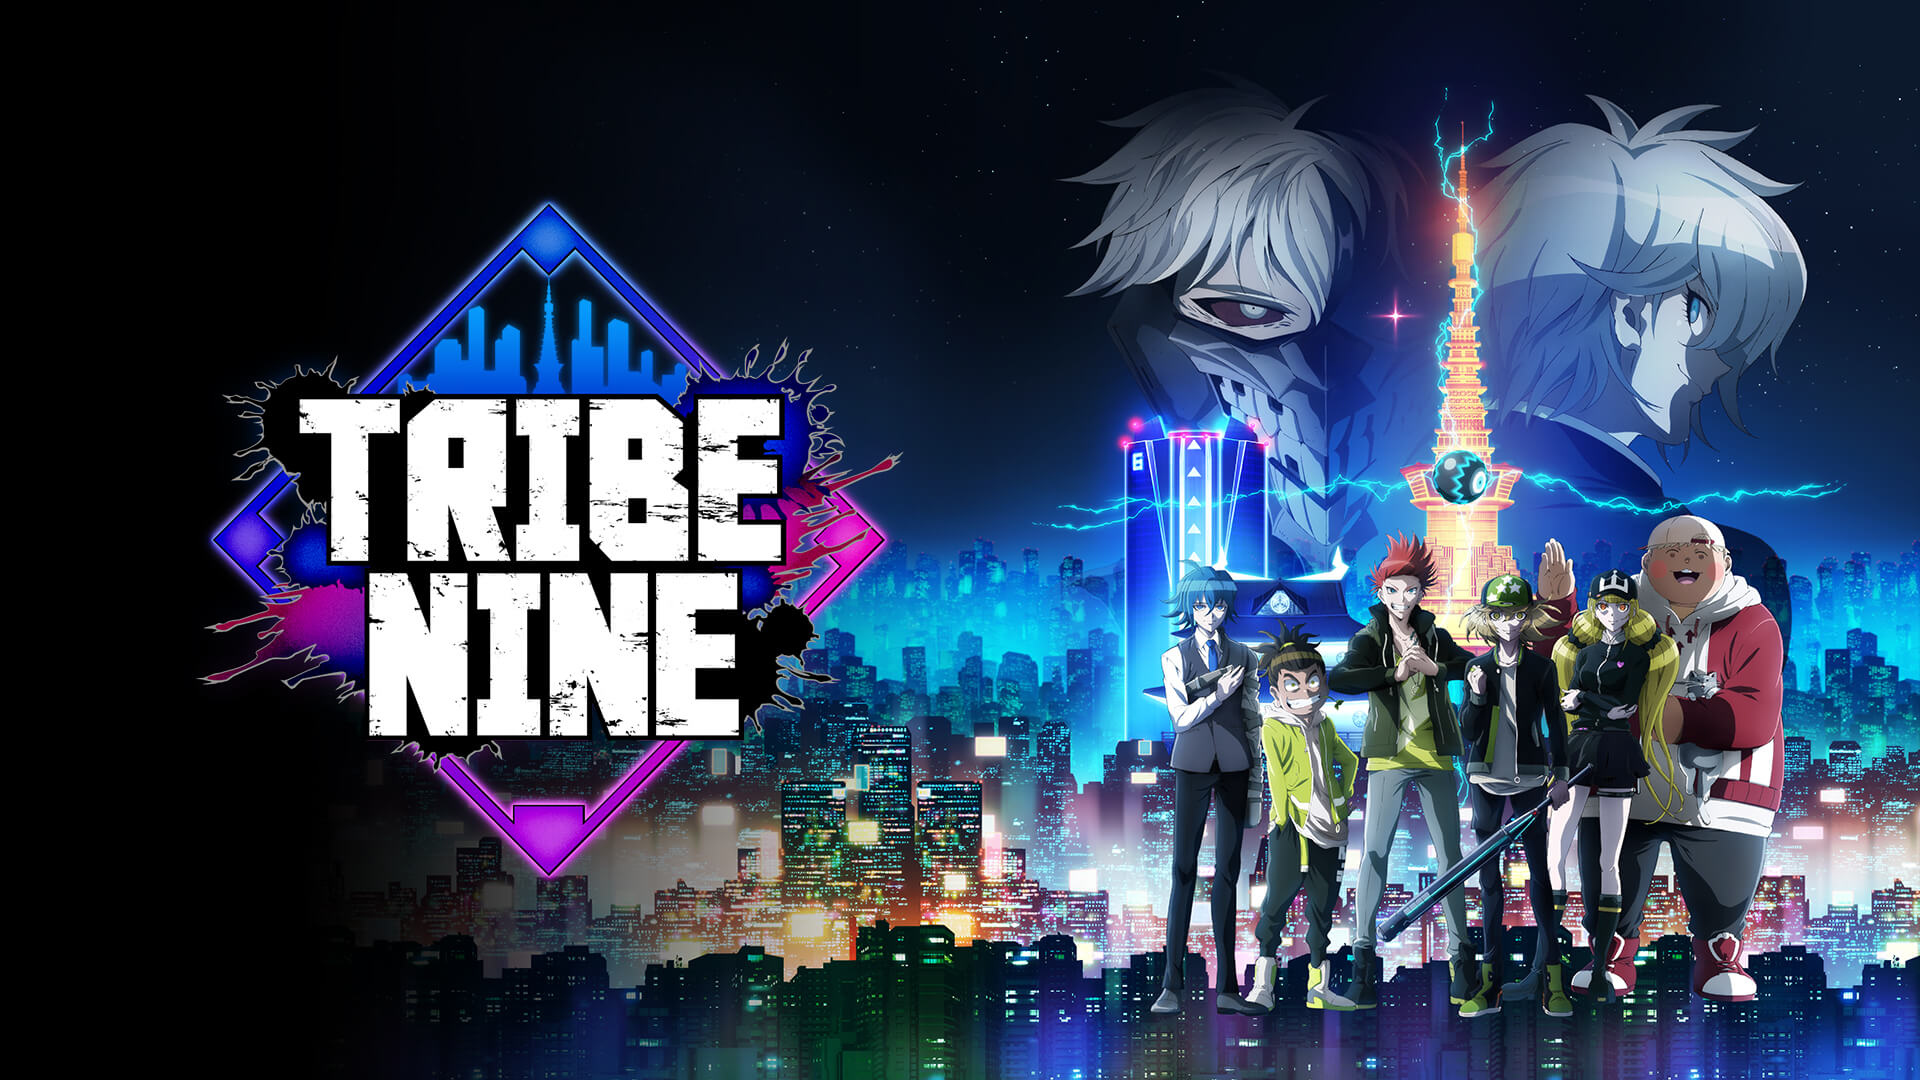 Tribe Nine release date speculation, platforms, and more [...]
[ Source: Pocket Tactics ]
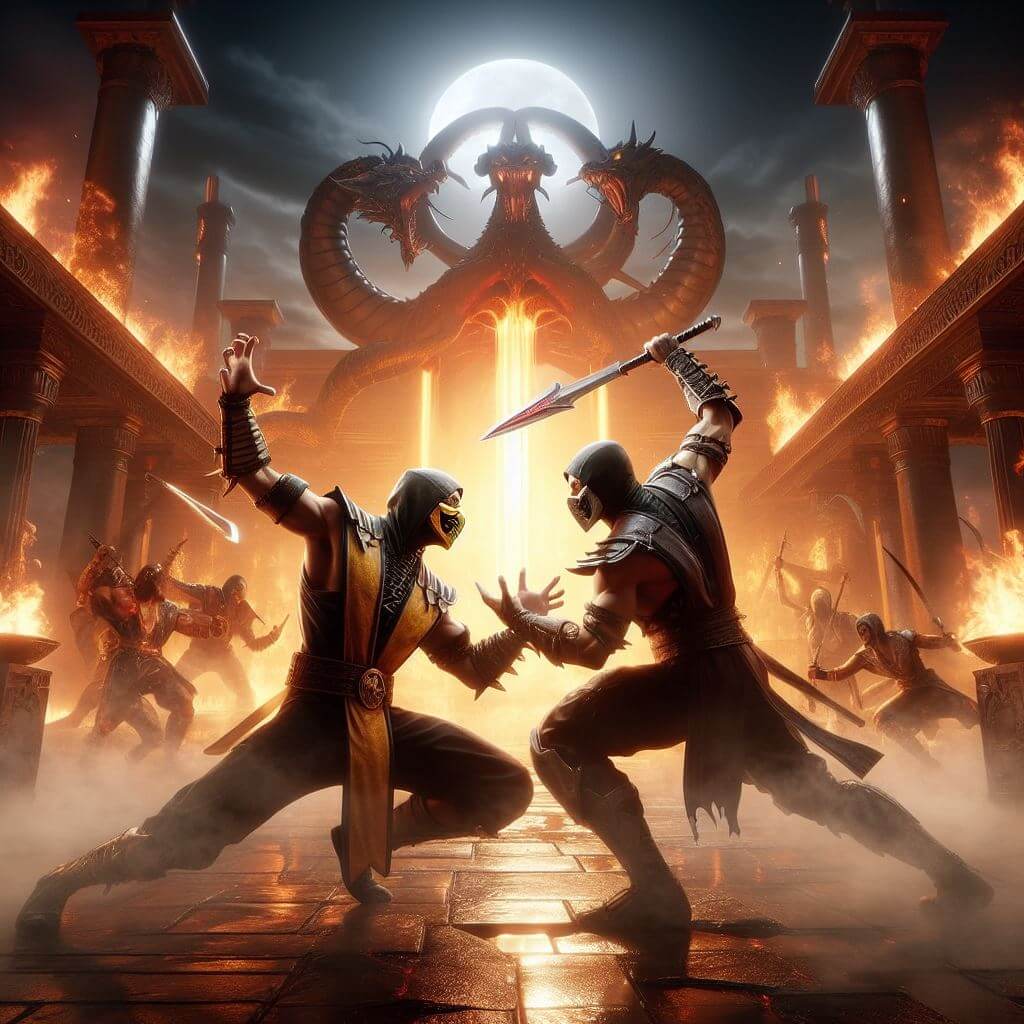 Ermac joins the Mortal Kombat 1 roster [...]
[ Source: RealSport101 ]
 Smite 2 shoots to the top of Steam's top sellers entirely through pre-order founder packs [...]
[ Source: VG247 ]
TL;DR Gaming News Today
Stray Fawn Studio - Build your sky city and defeat enemy pirates while exploring a vast
landscape in this Open World RPG City Builder, Airborne Empire! Wishlist now on Steam!
[ Source: GameTikker ]
 Cities: Skylines 2 Console Edition Delays Its Xbox Game Pass Launch [...]
[ Source: Pure Xbox ]
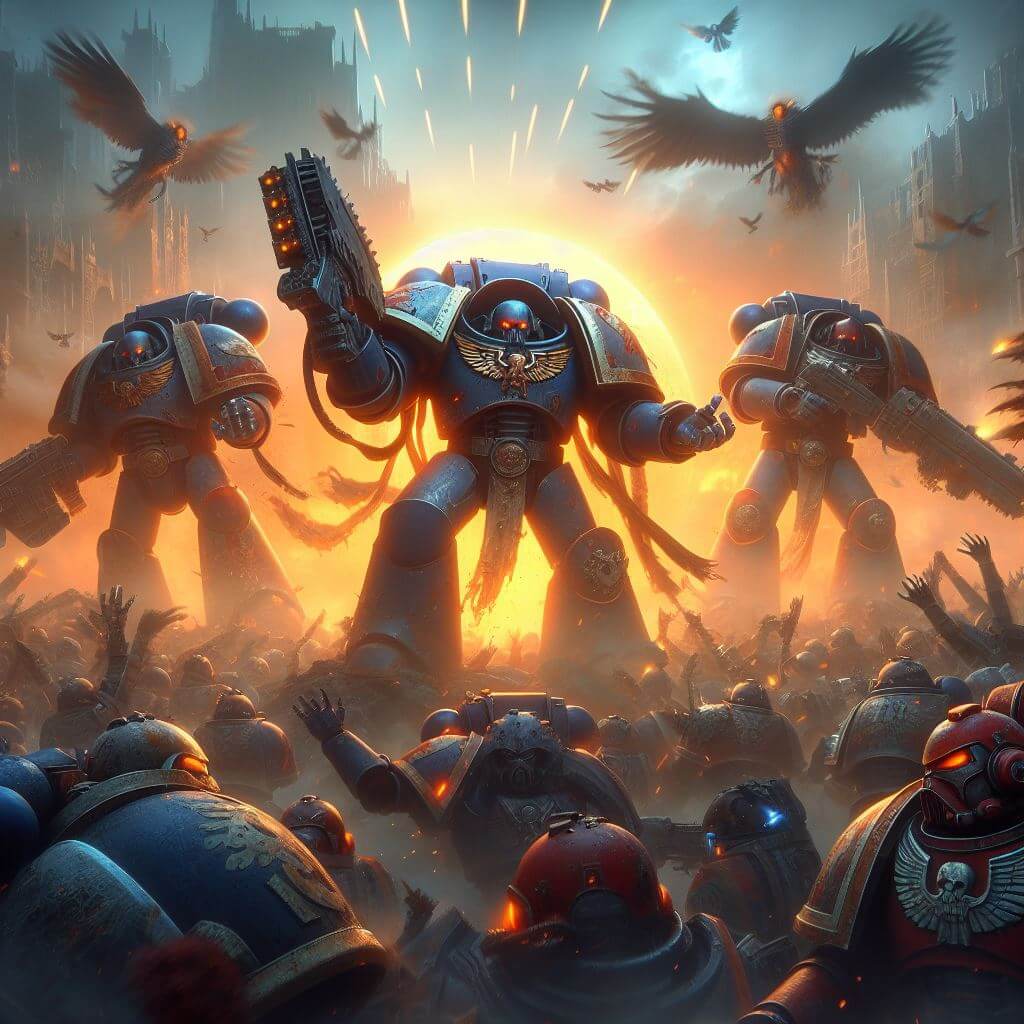 Embark On The Dark Zealots Raid In Warhammer 40,000: Warpforge's New Limited-Time Event [...]
[ Source: MMOBomb ]
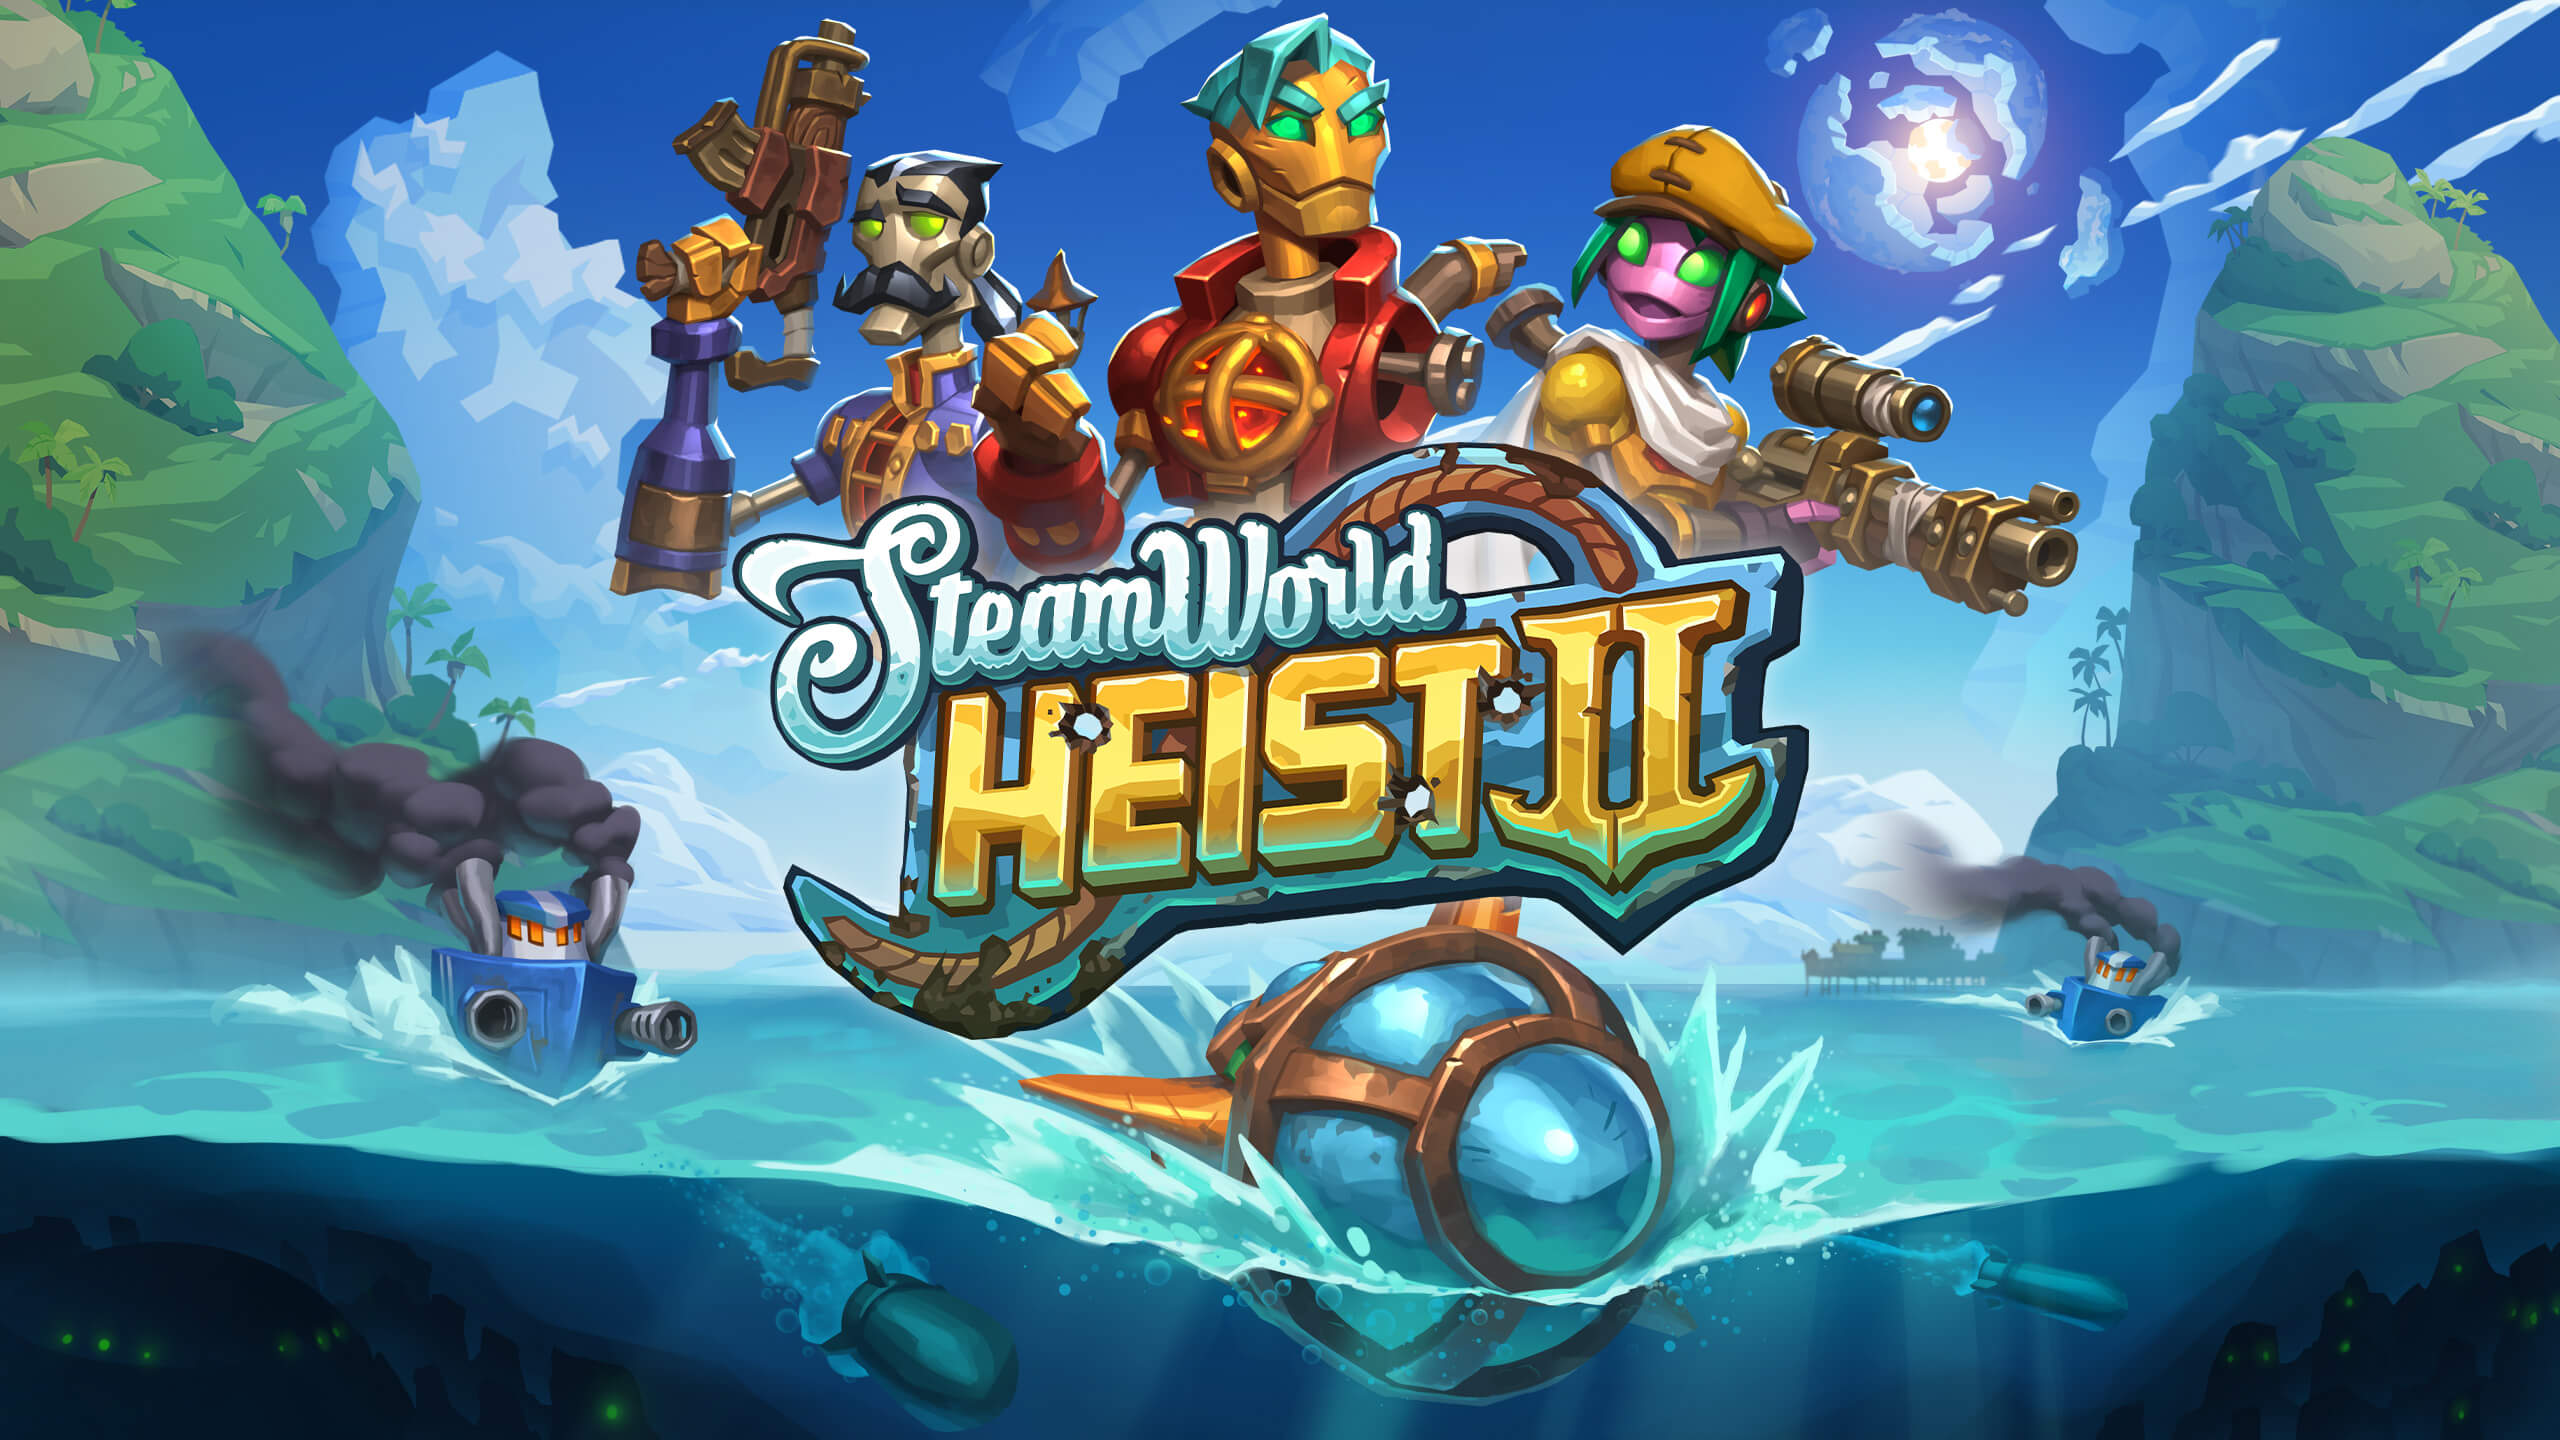 SteamWorld Heist 2 Announced, Launches August 8th for Consoles and PC [...]
[ Source: GamingBolt ]
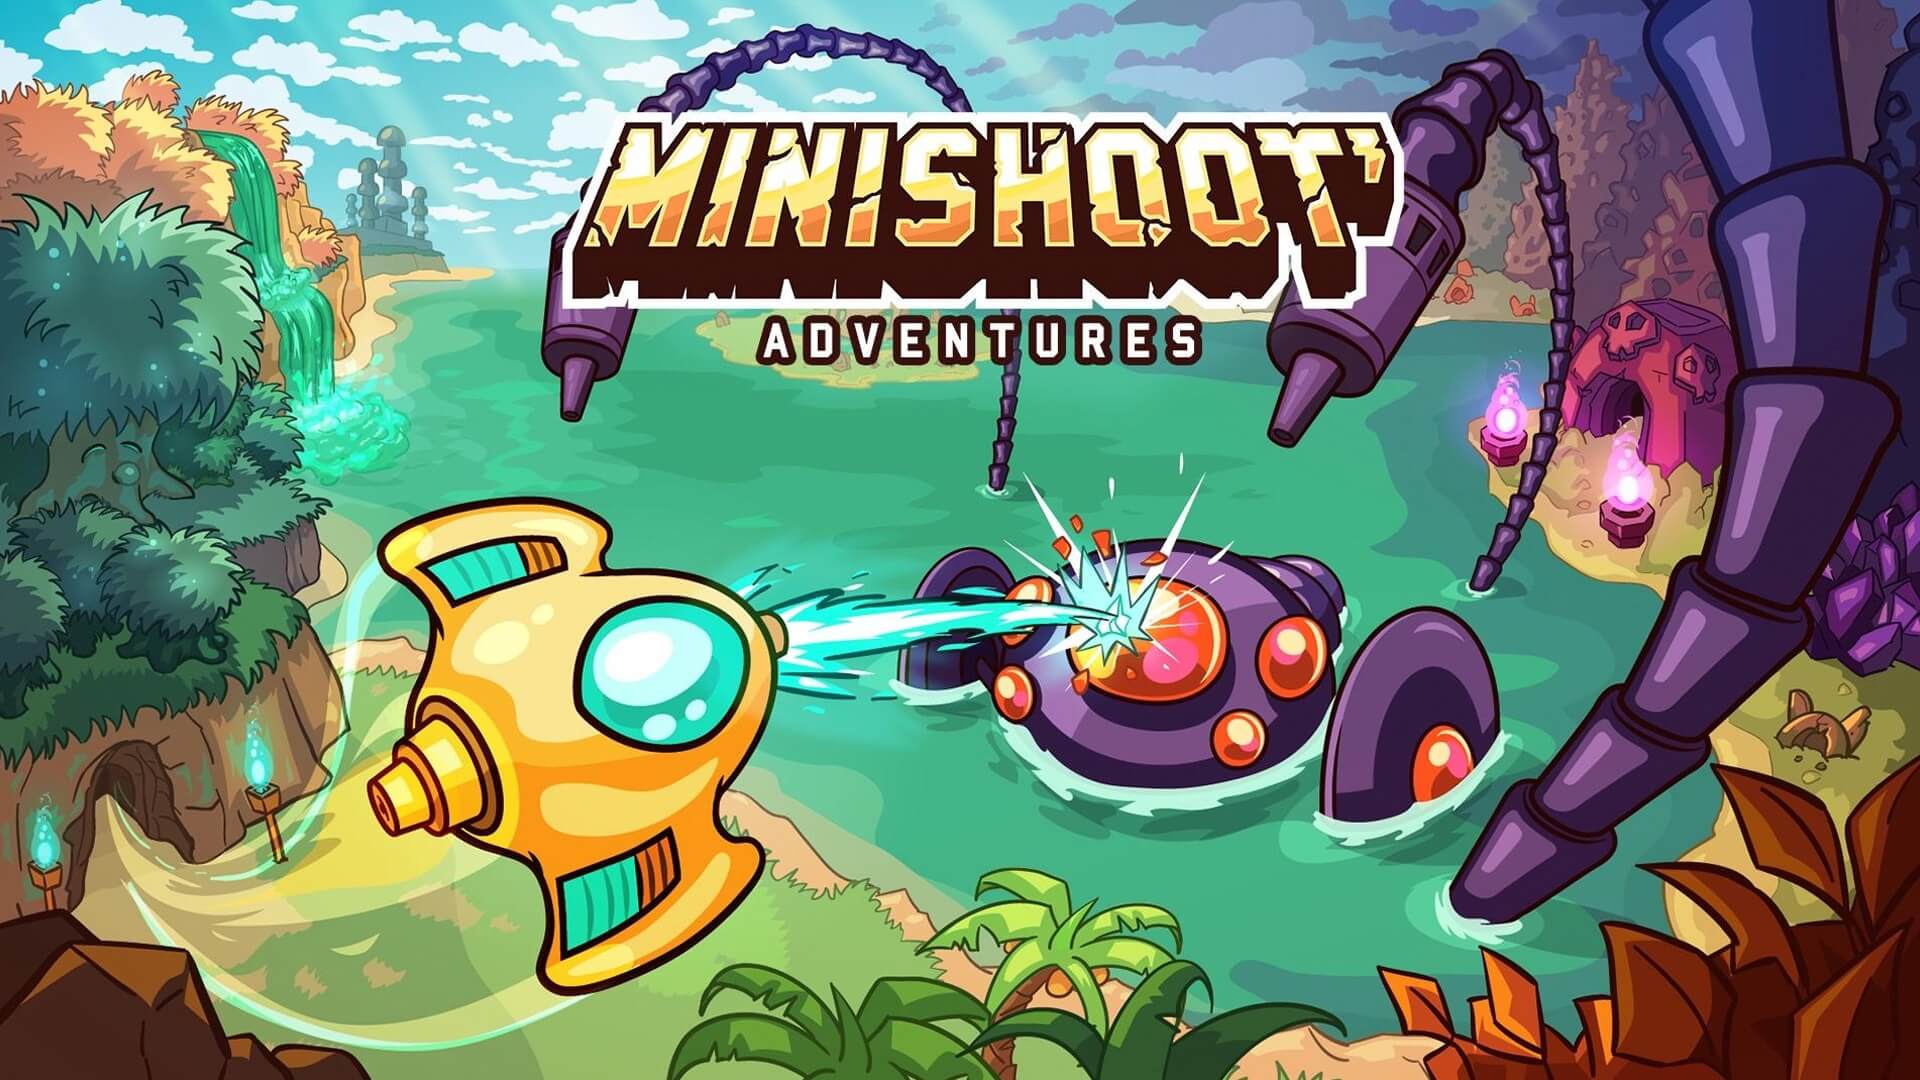 Minishoot’ Adventures is a match made in bullet heaven - Review [...]
[ Source: Entertainium ]
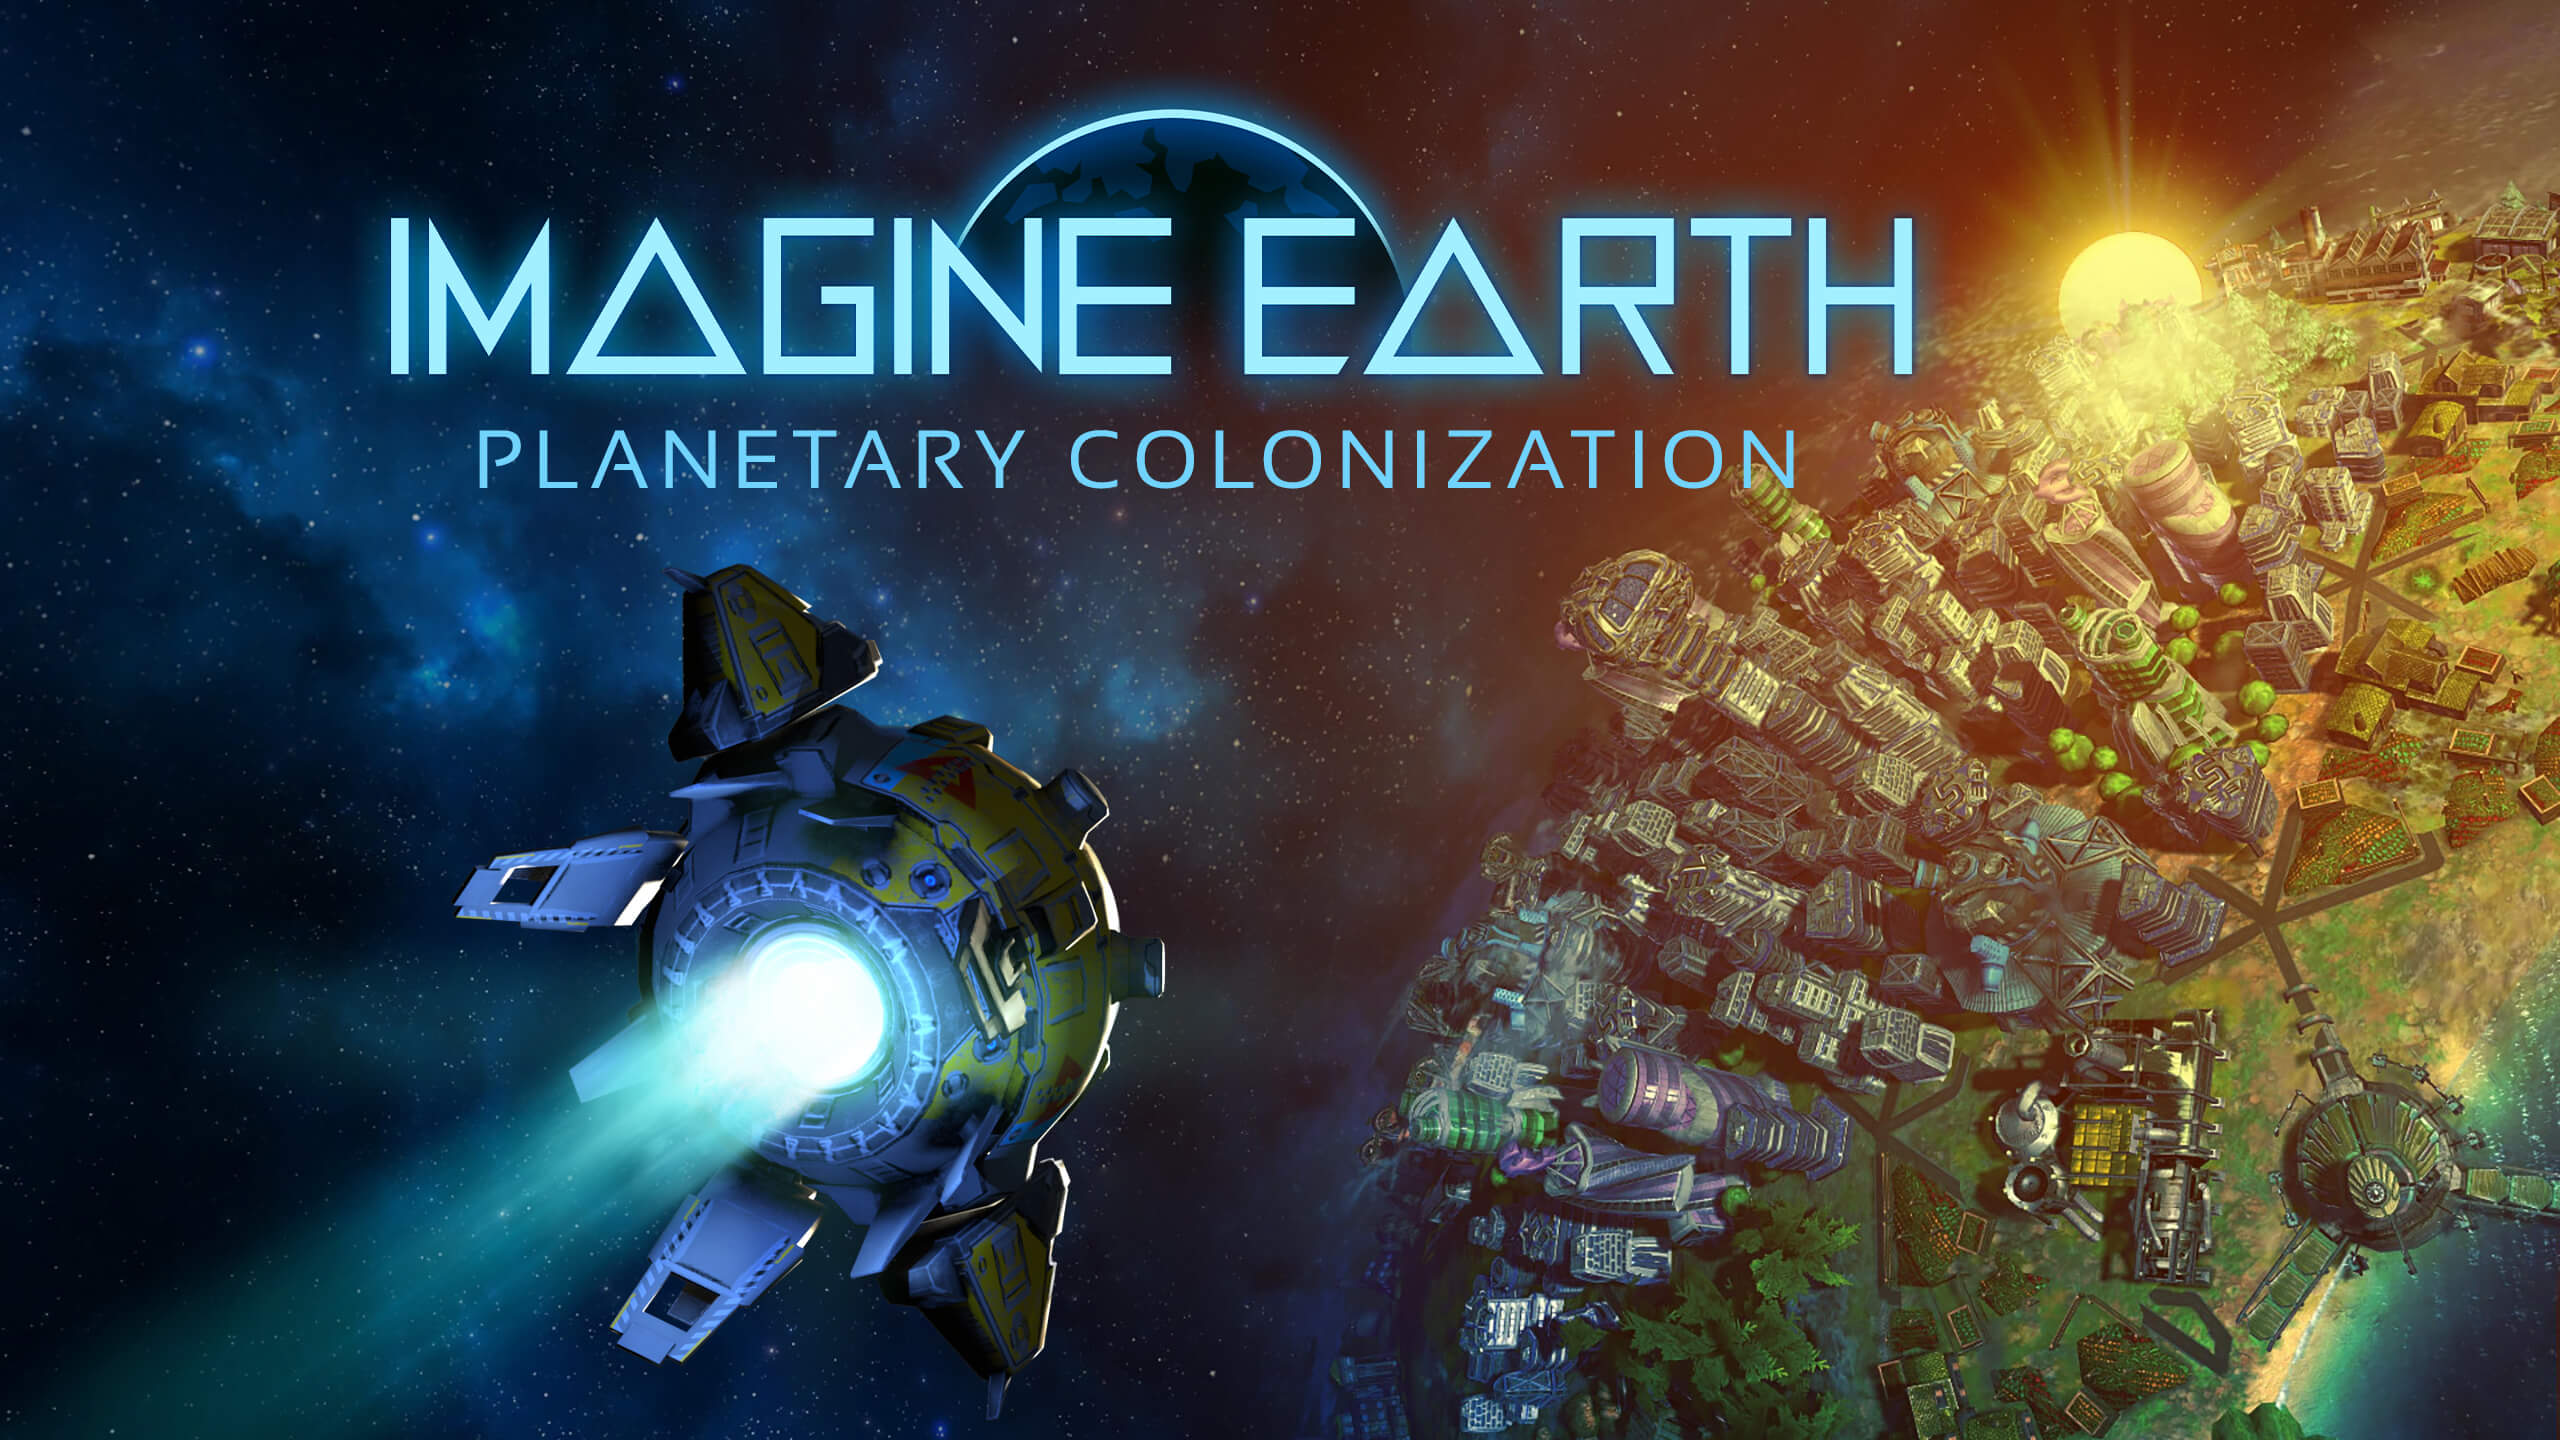 Imagine Earth - Switch, PlayStation and Mac Release on May 9 [...]
[ Source: Indie DB ]
 Dragon’s Dogma 2 Loses About 90% Of Its Players A Month Into Release [...]
[ Source: eXputer ]
TL;DR Gaming News Today
The Alters - Jan Dolski is a simple worker who's job opportunity turned out to be a desperate fight for
survival. Along with The Alters he will need to do whatever it takes to come back home. Wishlist on Steam!
[ Source: GameTikker ]
 The Nintendo Switch just got 2 surprise games [...]
[ Source: Digital Trends ]
 New Pokemon GO avatars are so ugly players are quitting the game [...]
[ Source: PC Invasion ]
 Xbox Game Pass April - Arrivals and Departures [...]
[ Source: DBLTAP ]
 Star Wars Outlaws Rating Confirms You Can Play Sabacc [...]
[ Source: The Tech Game ]
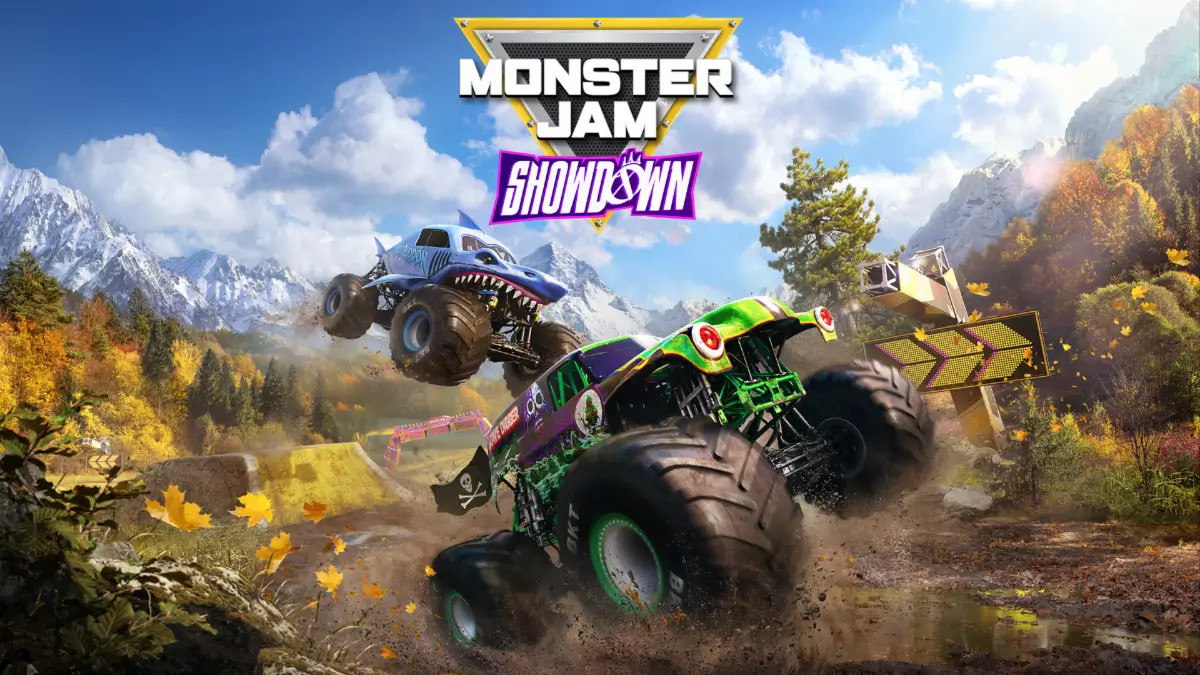 Monster Jam Showdown Releases on August 29 - New Details Revealed [...]
[ Source: Operation Sports ]
 Endless Ocean Luminous overview trailer [...]
[ Source: My Nintendo News ]
TL;DR Gaming News Today
Render Cube - Become the G.O.A.T among villagers in the Oxbow! Grab Medieval Dynasty -25% off now on Steam!
[ Source: GameTikker ]
 American Arcadia - Review [...]
[ Source: Adventure Gamers ]
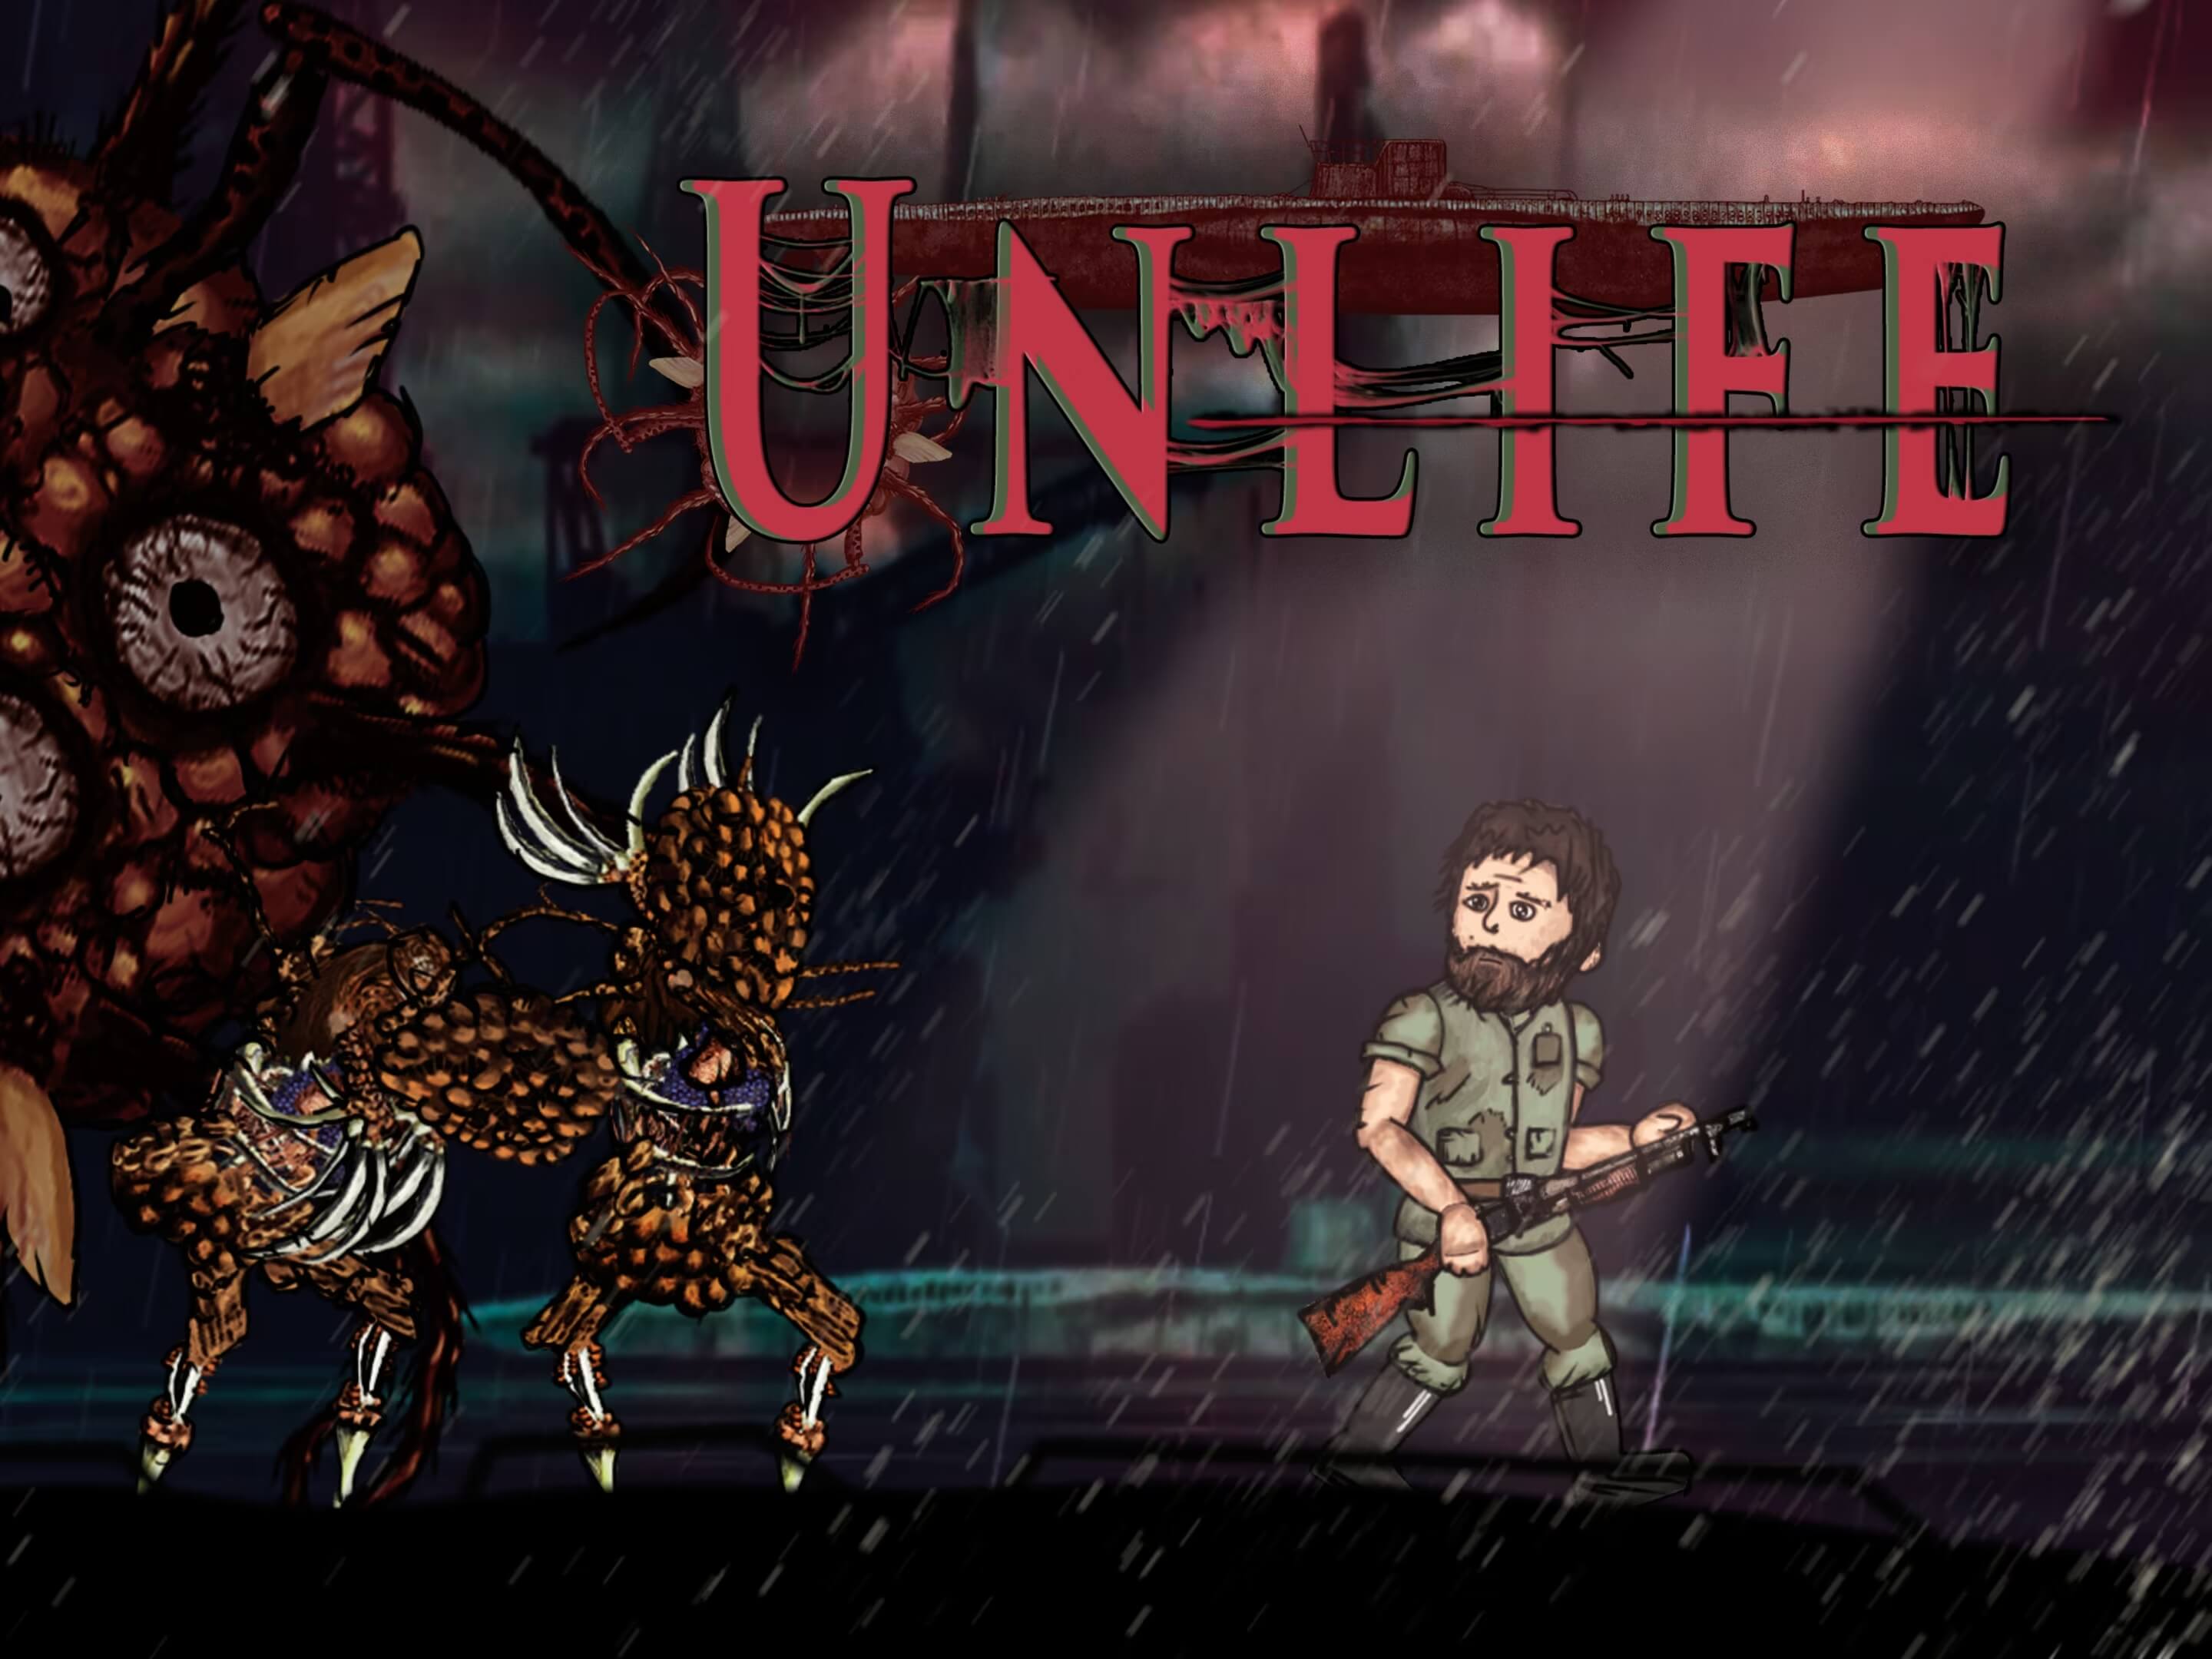 Unlife (Nintendo Switch) - Review [...]
[ Source: Pure Nintendo ]
 Electronic Arts Bets on Open Worlds in New Superhero Games [...]
[ Source: Gamepressure ]
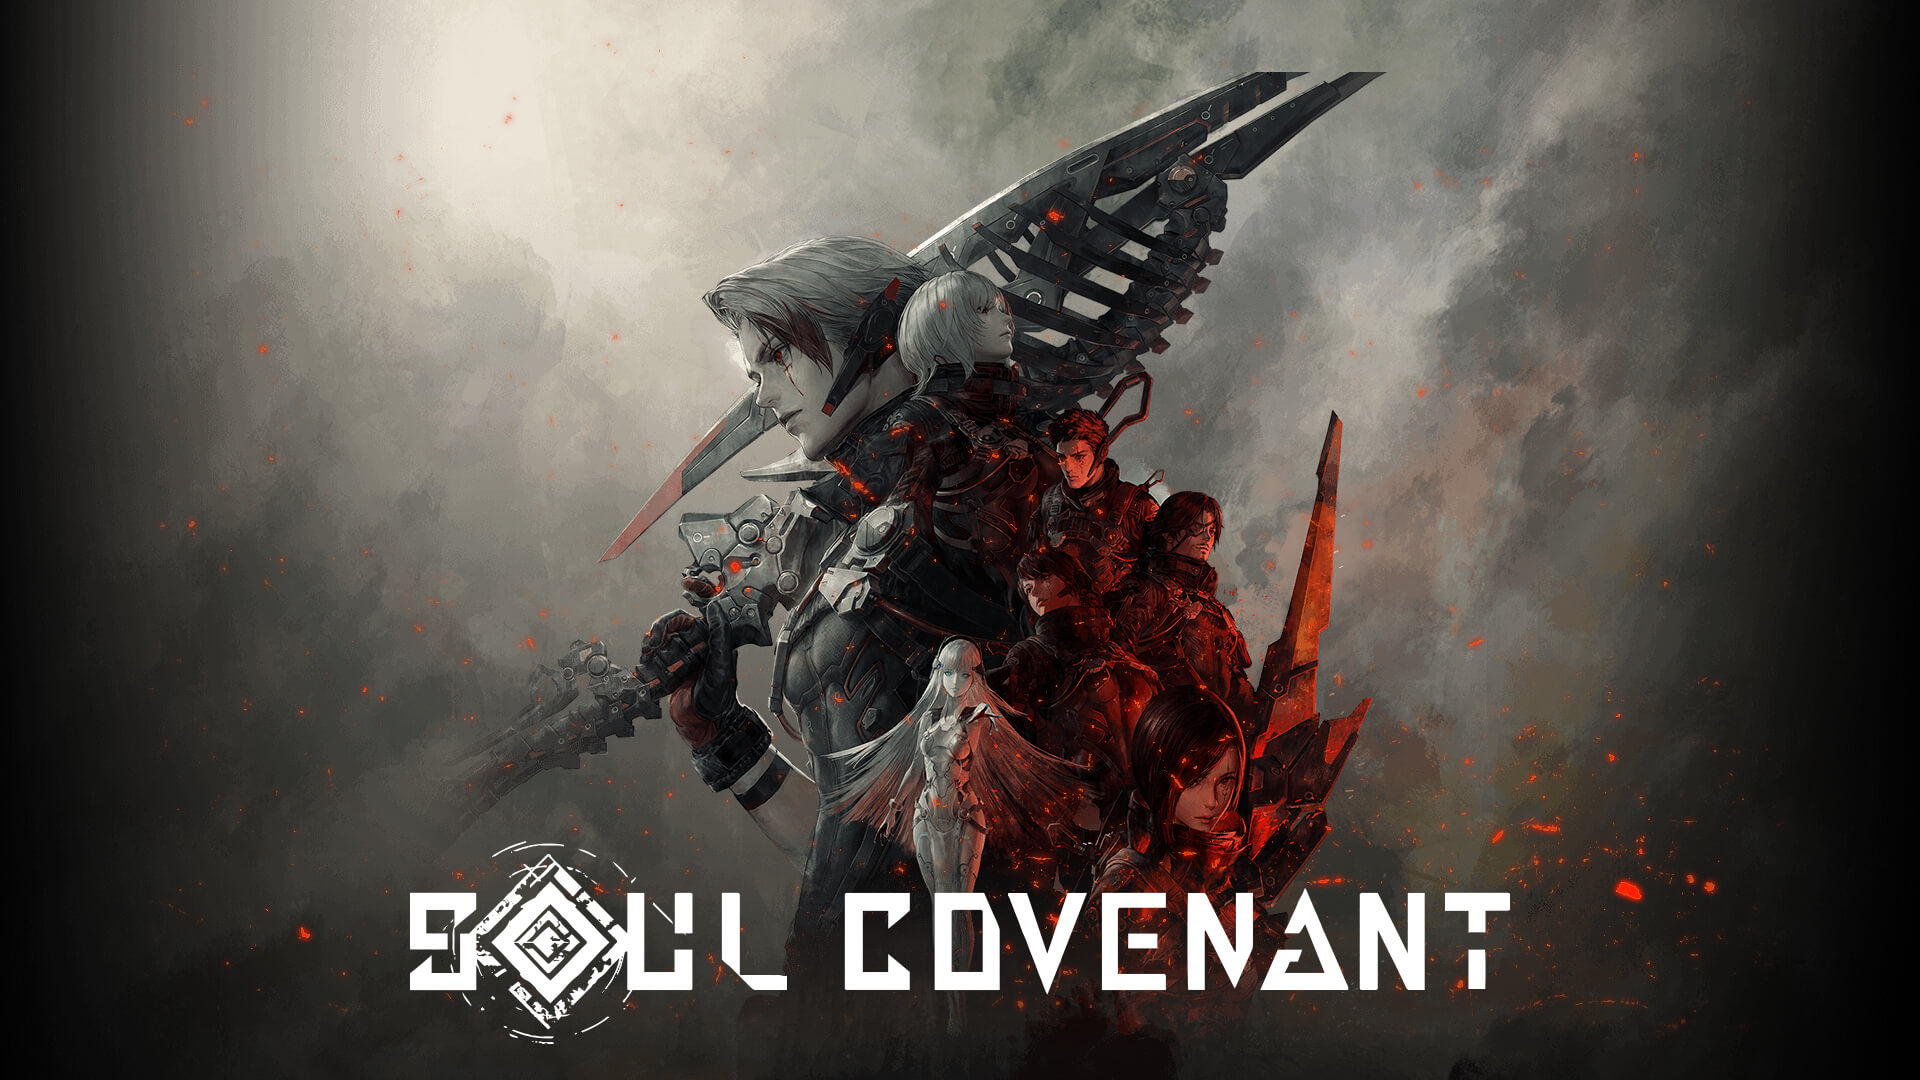 Spiritual Successor to One of the Best Vita Game’s Soul Sacrifice, ‘Soul Covenant’ is Available Now on VR Platforms [...]
[ Source: Noisy Pixel ]
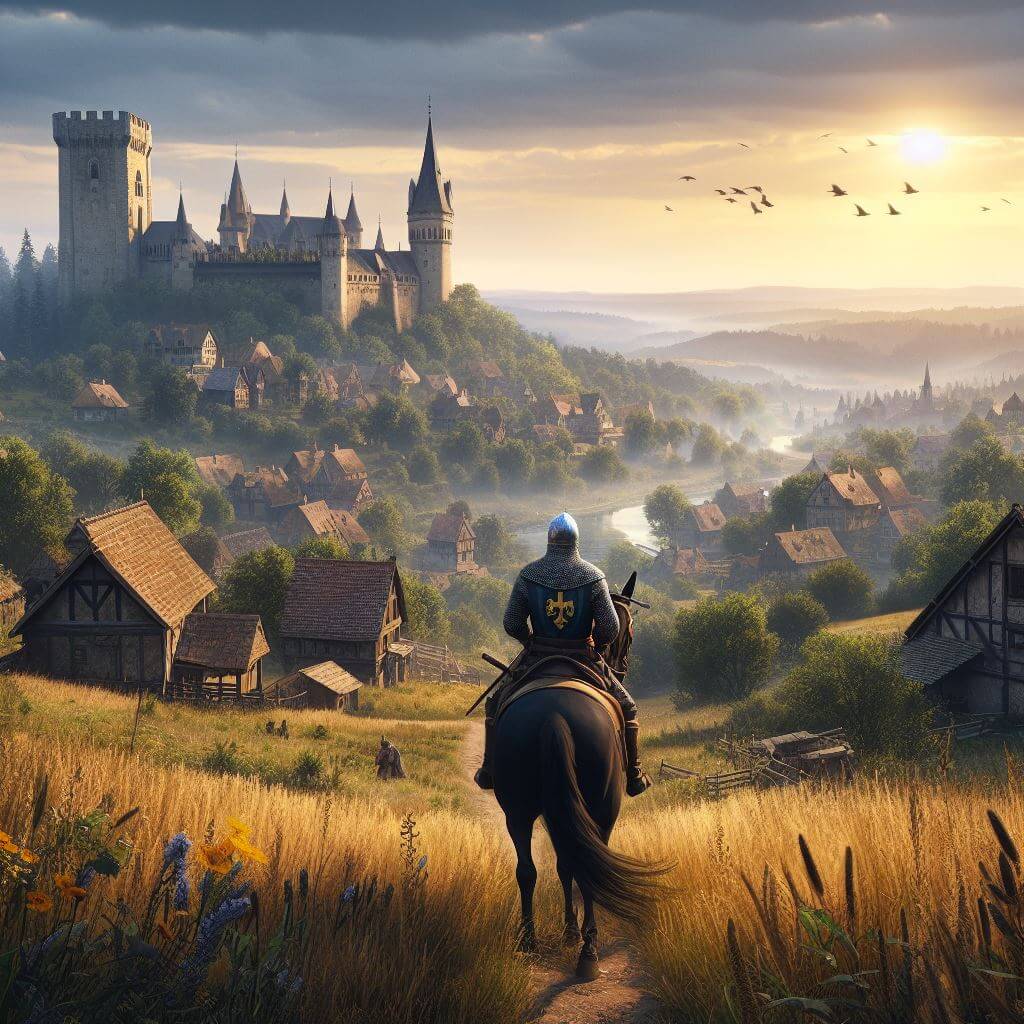 Kingdom Come: Deliverance II Announced for PS5, Xbox Series X|S, and PC [...]
[ Source: VGChartz ]
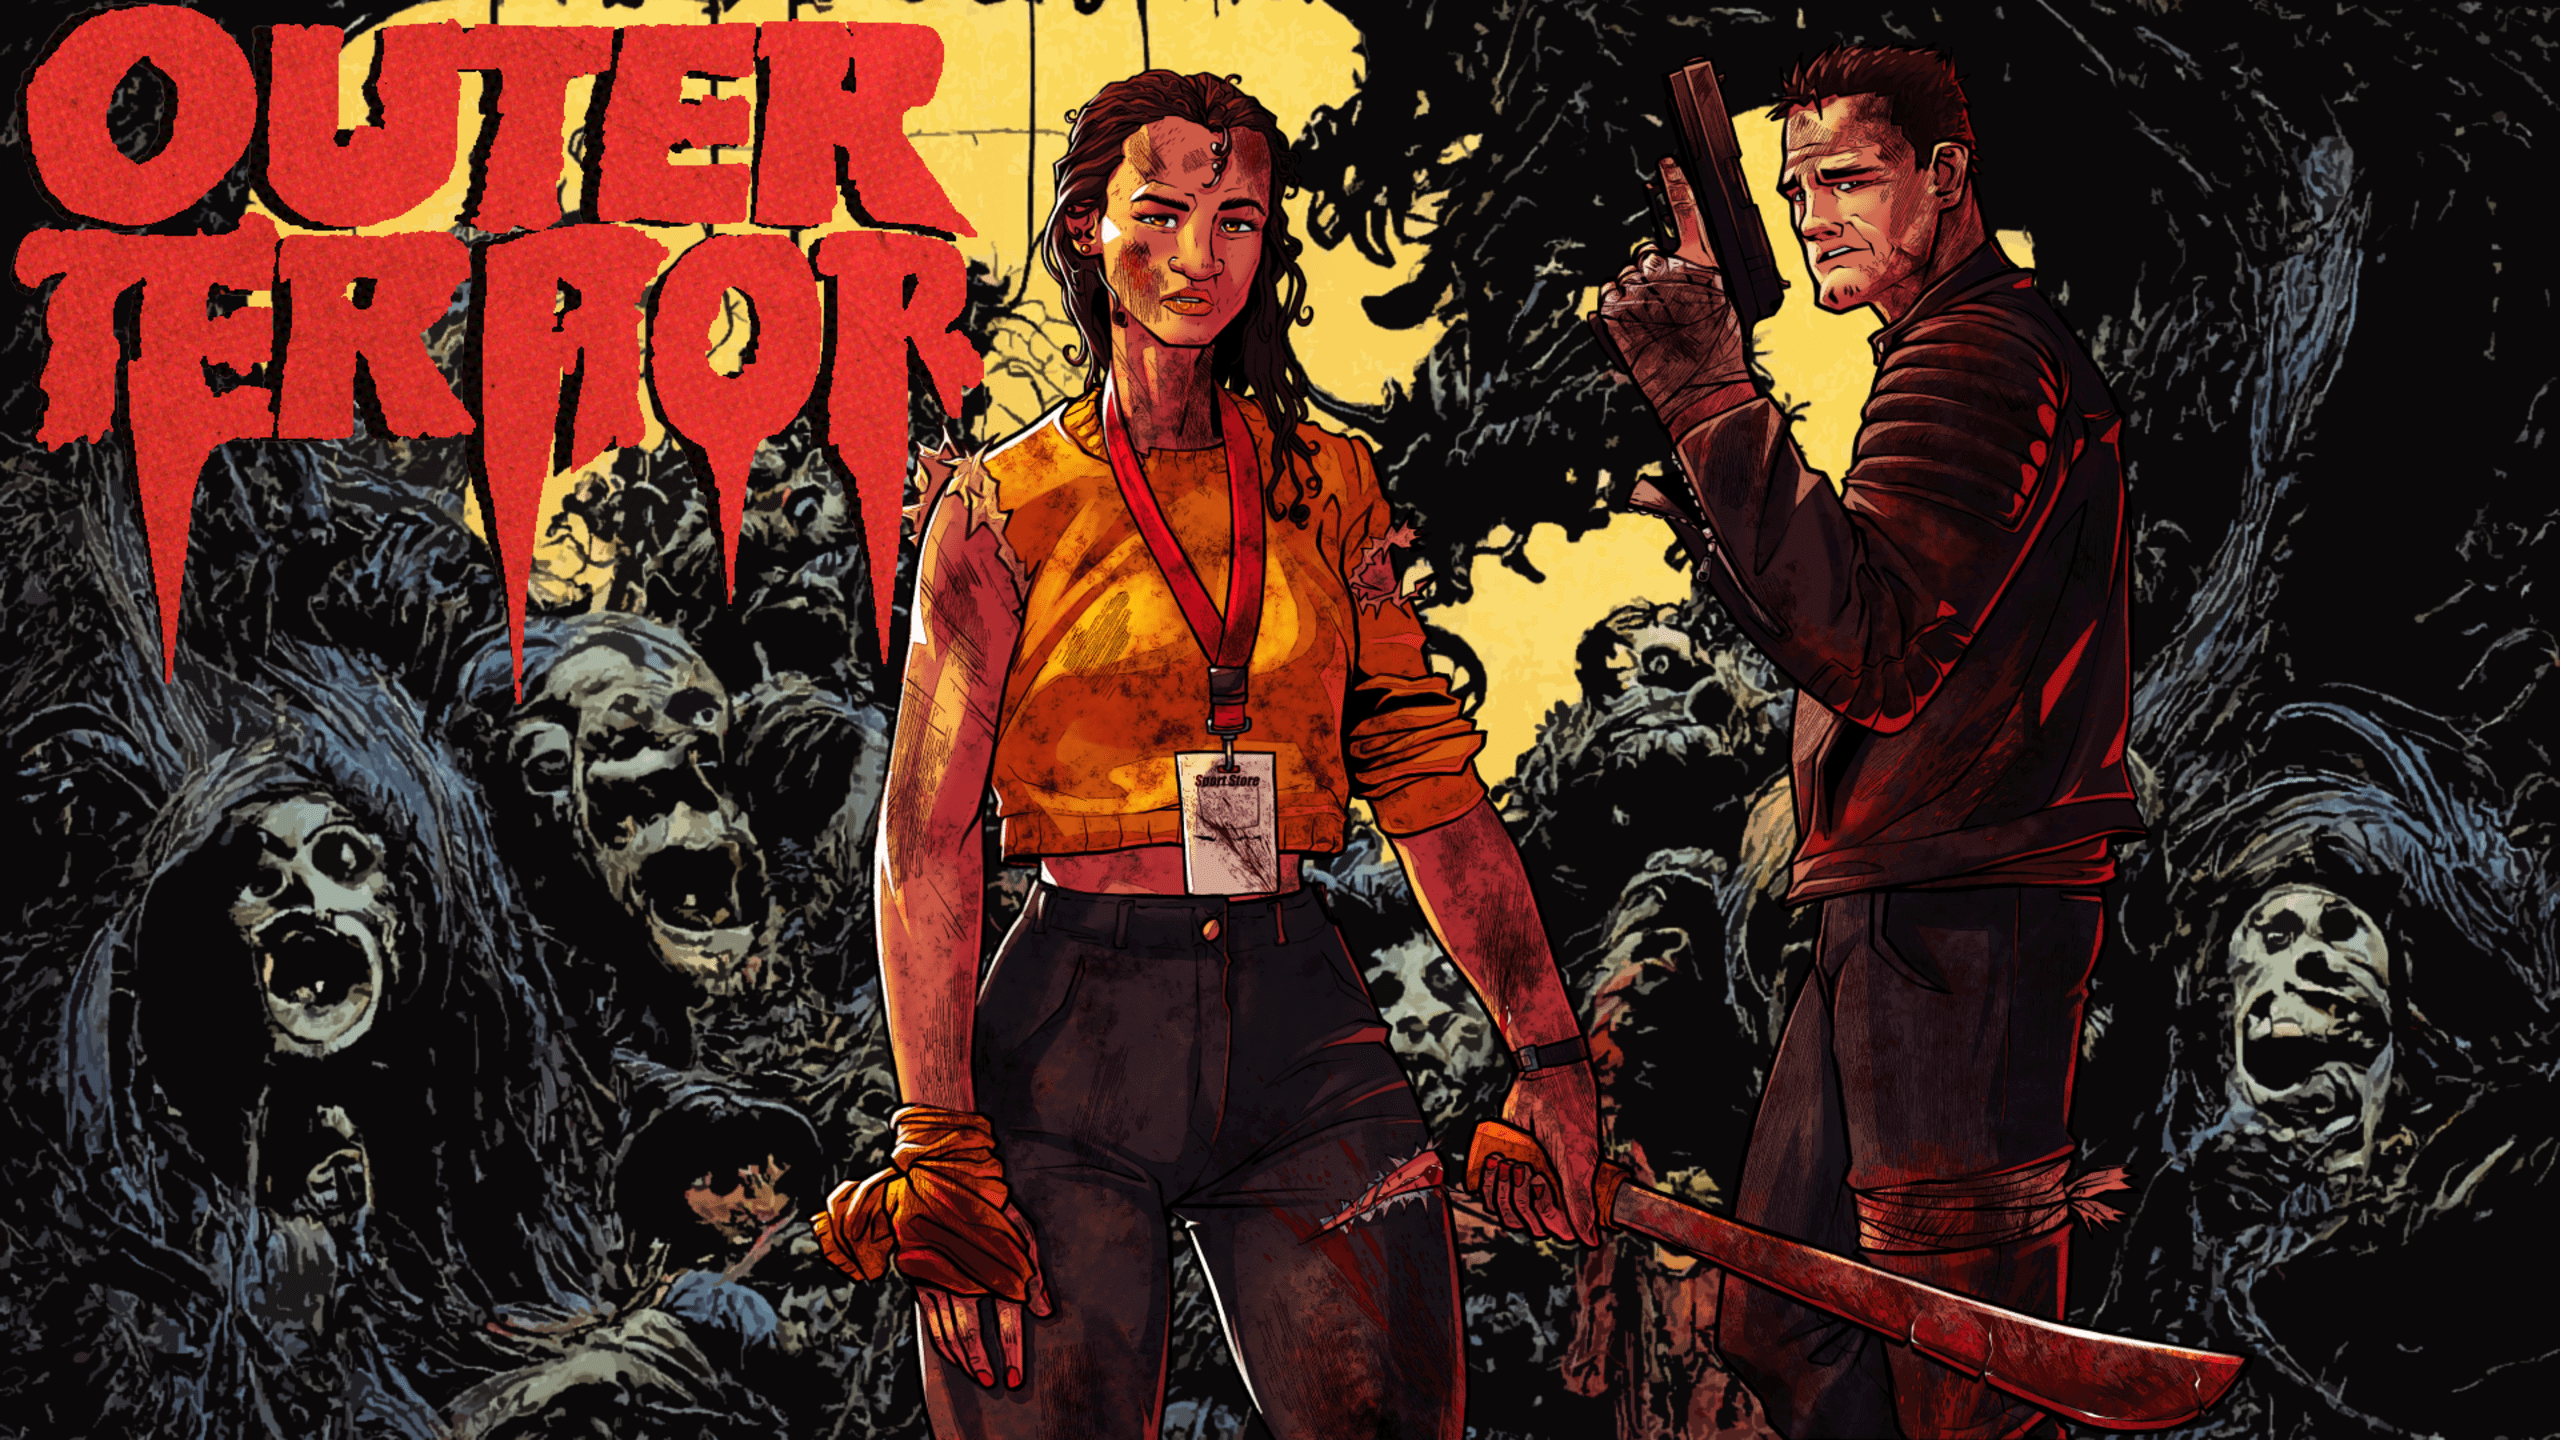 Outer Terror - PS5 Review [...]
[ Source: PlayStation Country ]
TL;DR Gaming News Today
Contra - Each weapon in Contra: Operation Galuga has a character-specific alt form! The trusty M's alt is Rapid Discs,
which fires boomerang-like projectiles that will obliterate anything sneaking up behind you. Contra: Operation Galuga
is out now on consoles and PC!
[ Source: GameTikker ]
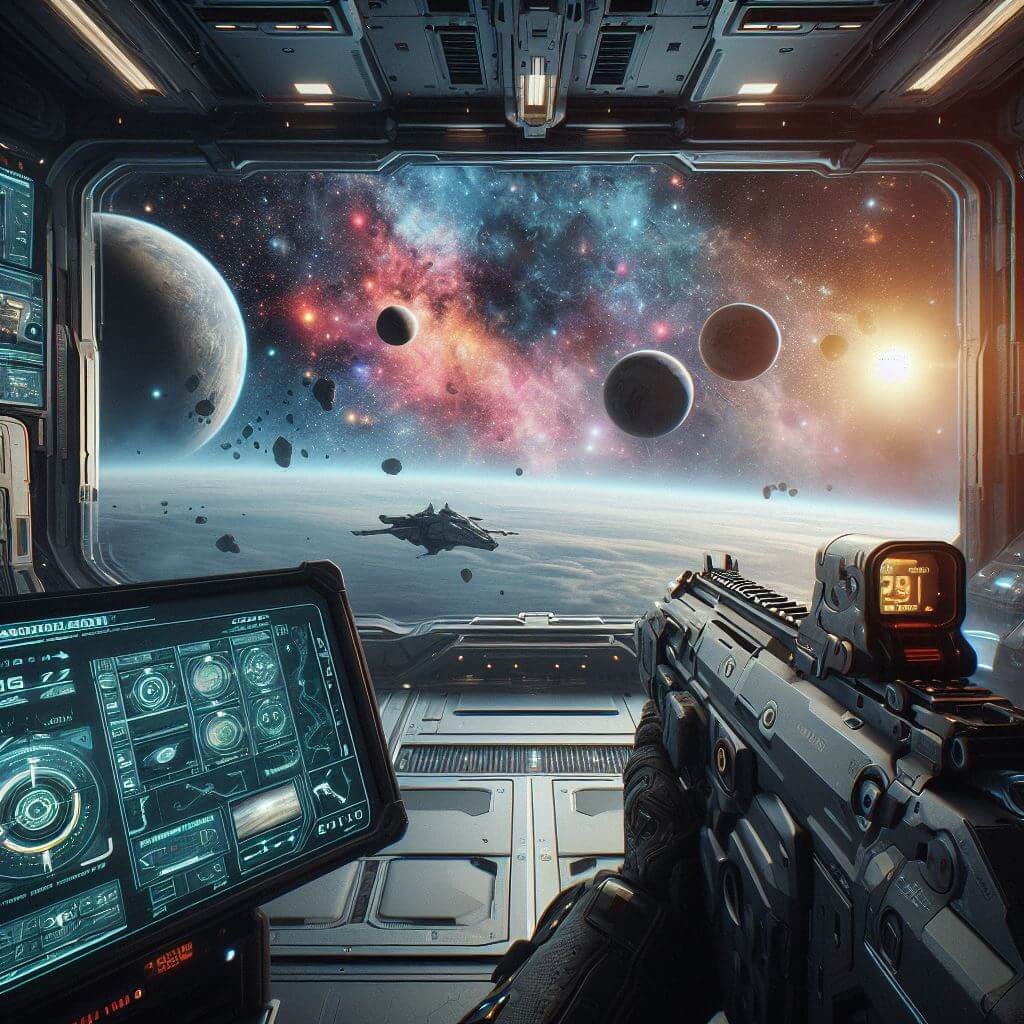 Bethesda promises some 'really good updates' for Starfield are going to be revealed soon [...]
[ Source: TweakTown ]
 NCSoft Announce Guild Wars 3 [...]
[ Source: MMOByte ]
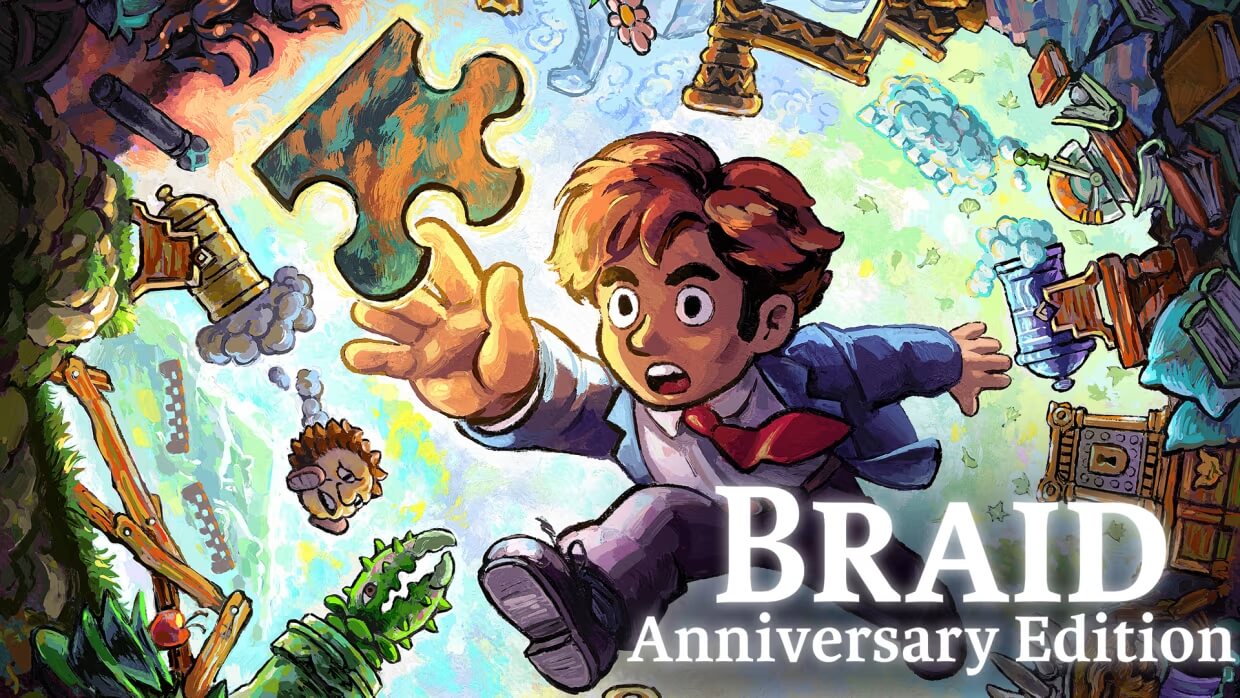 Braid Anniversary Edition Release Date Pushed Back to May [...]
[ Source: GameSkinny ]
 Star Wars Battlefront Classic Collection - Review [...]
[ Source: Player2 ]
 Intel & Ubisoft Announce Collaboration For Star Wars Outlaws [...]
[ Source: cgm ]
 Stunt Paradise - Review [...]
[ Source: Gamerhub ]
TL;DR Gaming News Today
Sonomio Games - Saddle up, pardners! Lone McLonegan rustles up savings from April
17th to 23rd on the Nintendo Switch Indie Sale! 85% off in Europe and America.
[ Source: GameTikker ]
 Blizzard Opens Sign-Ups For This Summer’s World Of Warcraft: The War Within Beta Test [...]
[ Source: MMOs ]
 10 PS1 Games That Aged Beautifully Well [...]
[ Source: Cultured Vultures ]
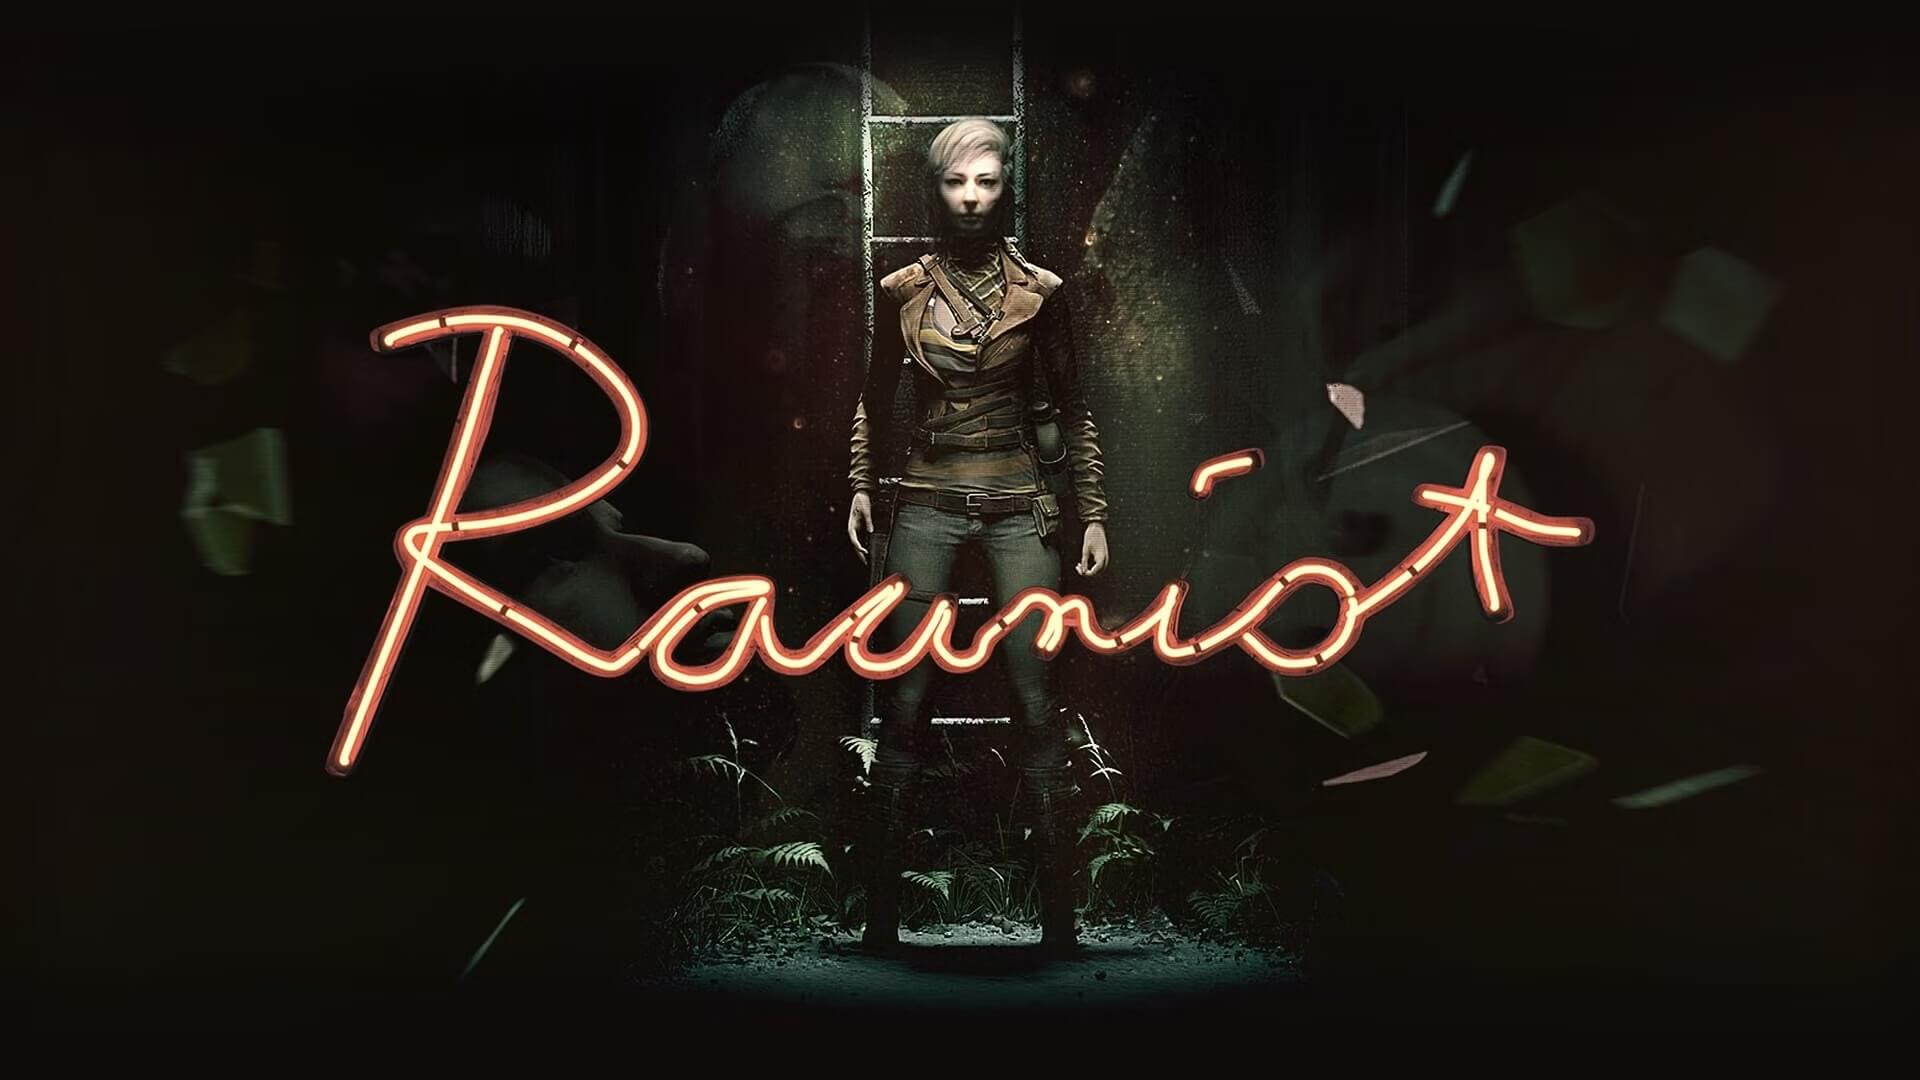 Rauniot - Review [...]
[ Source: Jump Dash Roll ]
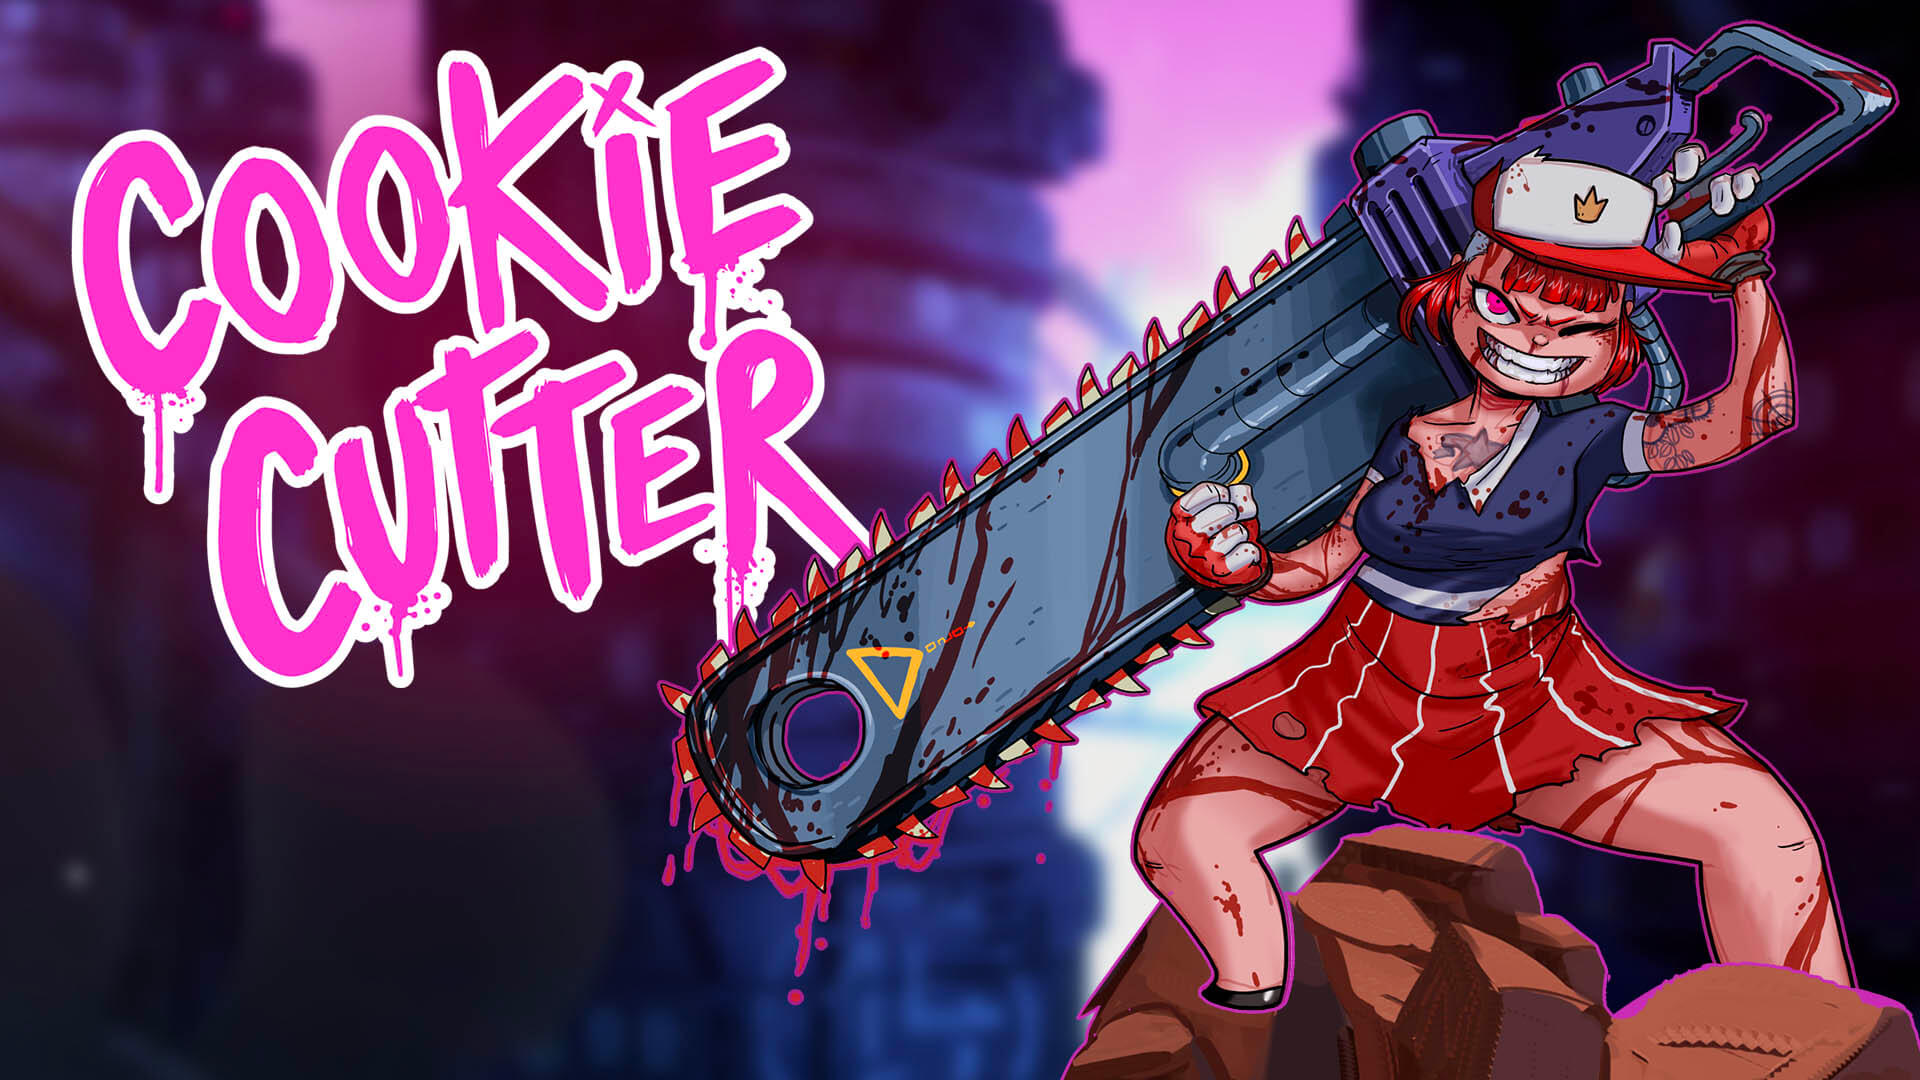 Cookie Cutter (Xbox Series X) - Review [...]
[ Source: XboxAddict ]
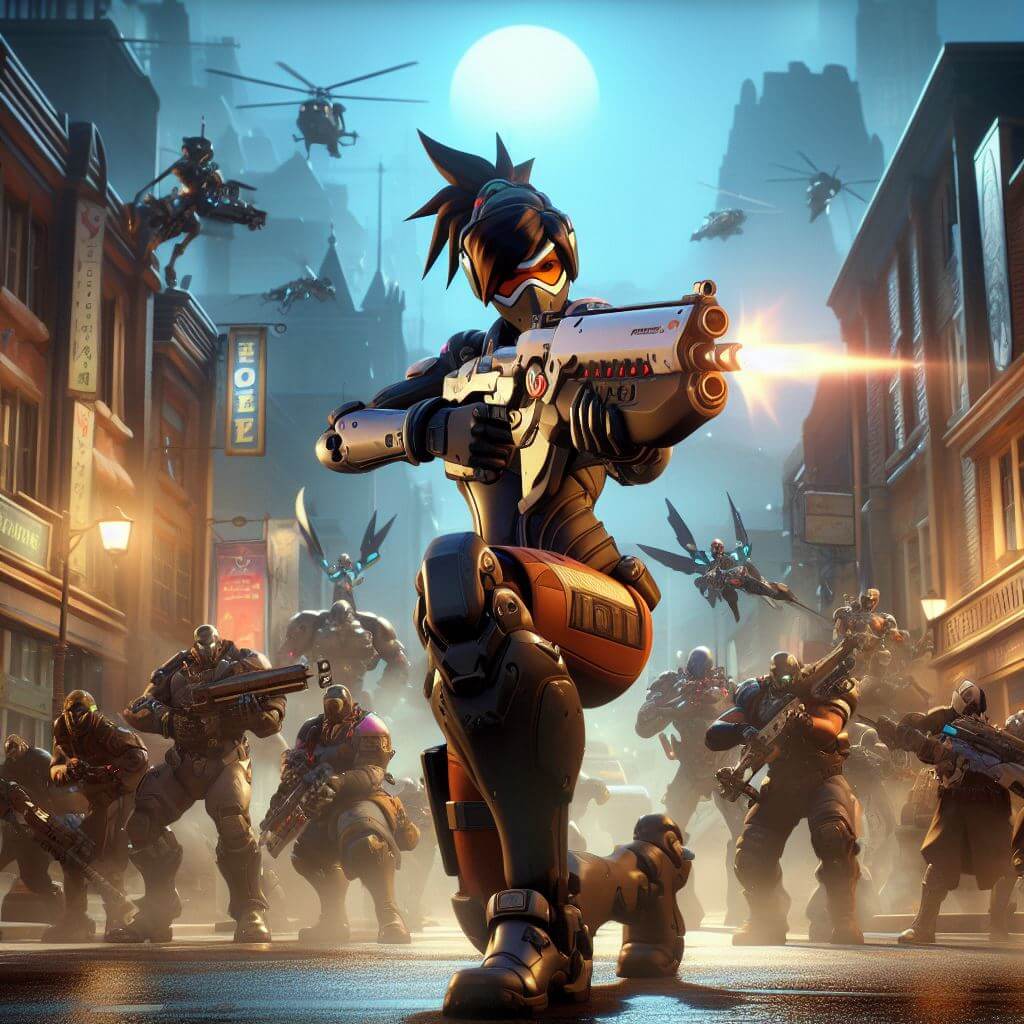 Overwatch 2’s Newest Hero Enters Ranked Play Immediately [...]
[ Source: WellPlayed ]
 Massive Call of Duty 2024 leaks point at returning franchise weapons and perks [...]
[ Source: GGRecon ]
TL;DR Gaming News Today
Yummy Games - Our team of 4 is bringing you an exciting mix of intense bullet hell combat with a unique
morphing mechanic in our upcoming game: PROJECT TOWER! Wishlist on PLAYSTATION to join the adventure!
[ Source: GameTikker ]
 Hades II now streaming Technical Test [...]
[ Source: Gaming Nexus ]
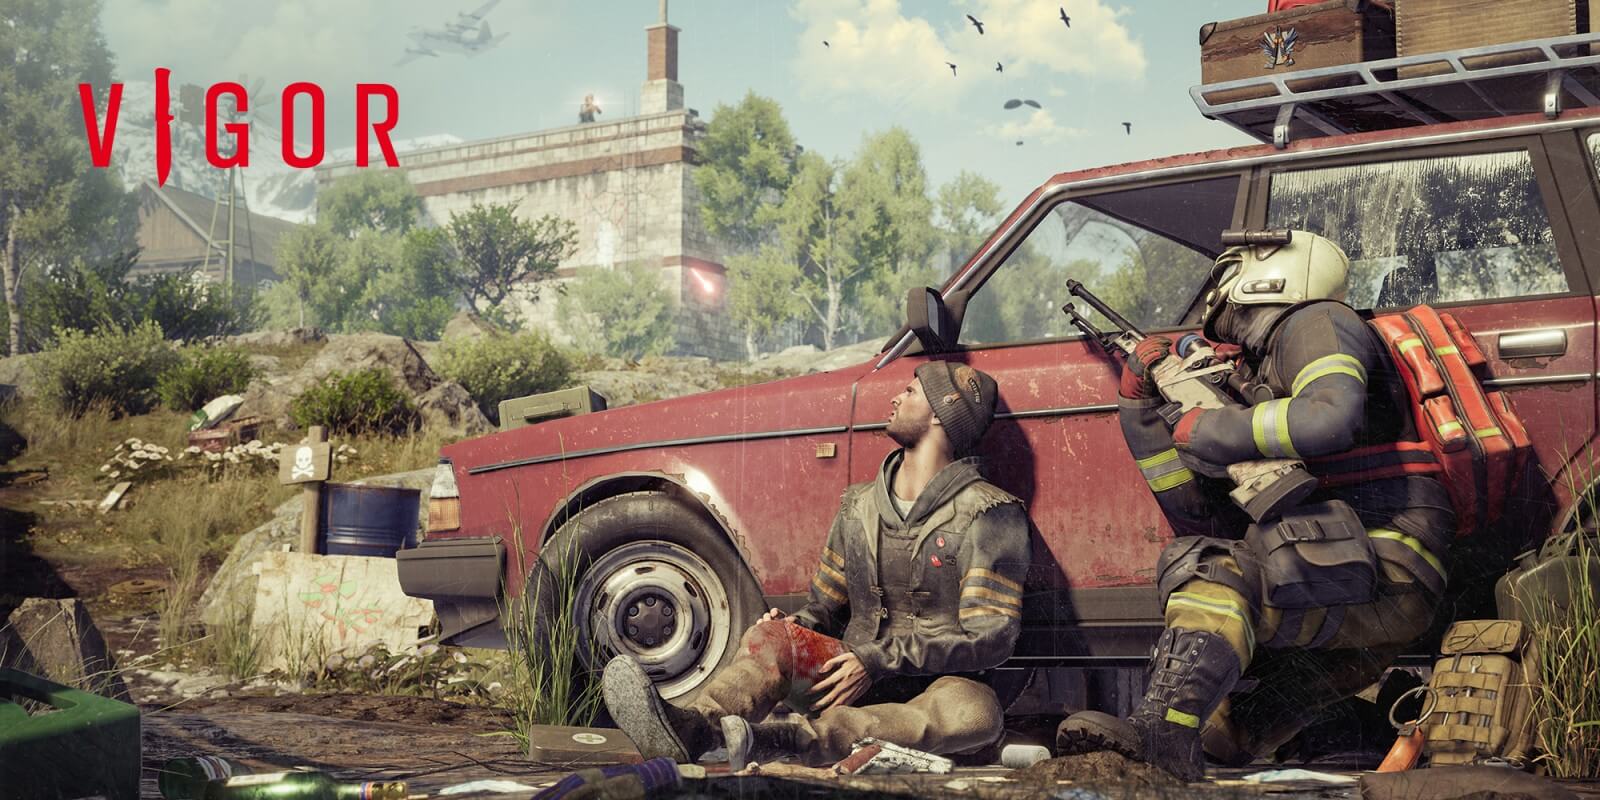 PC Vigor Next Month [...]
[ Source: Blues News ]
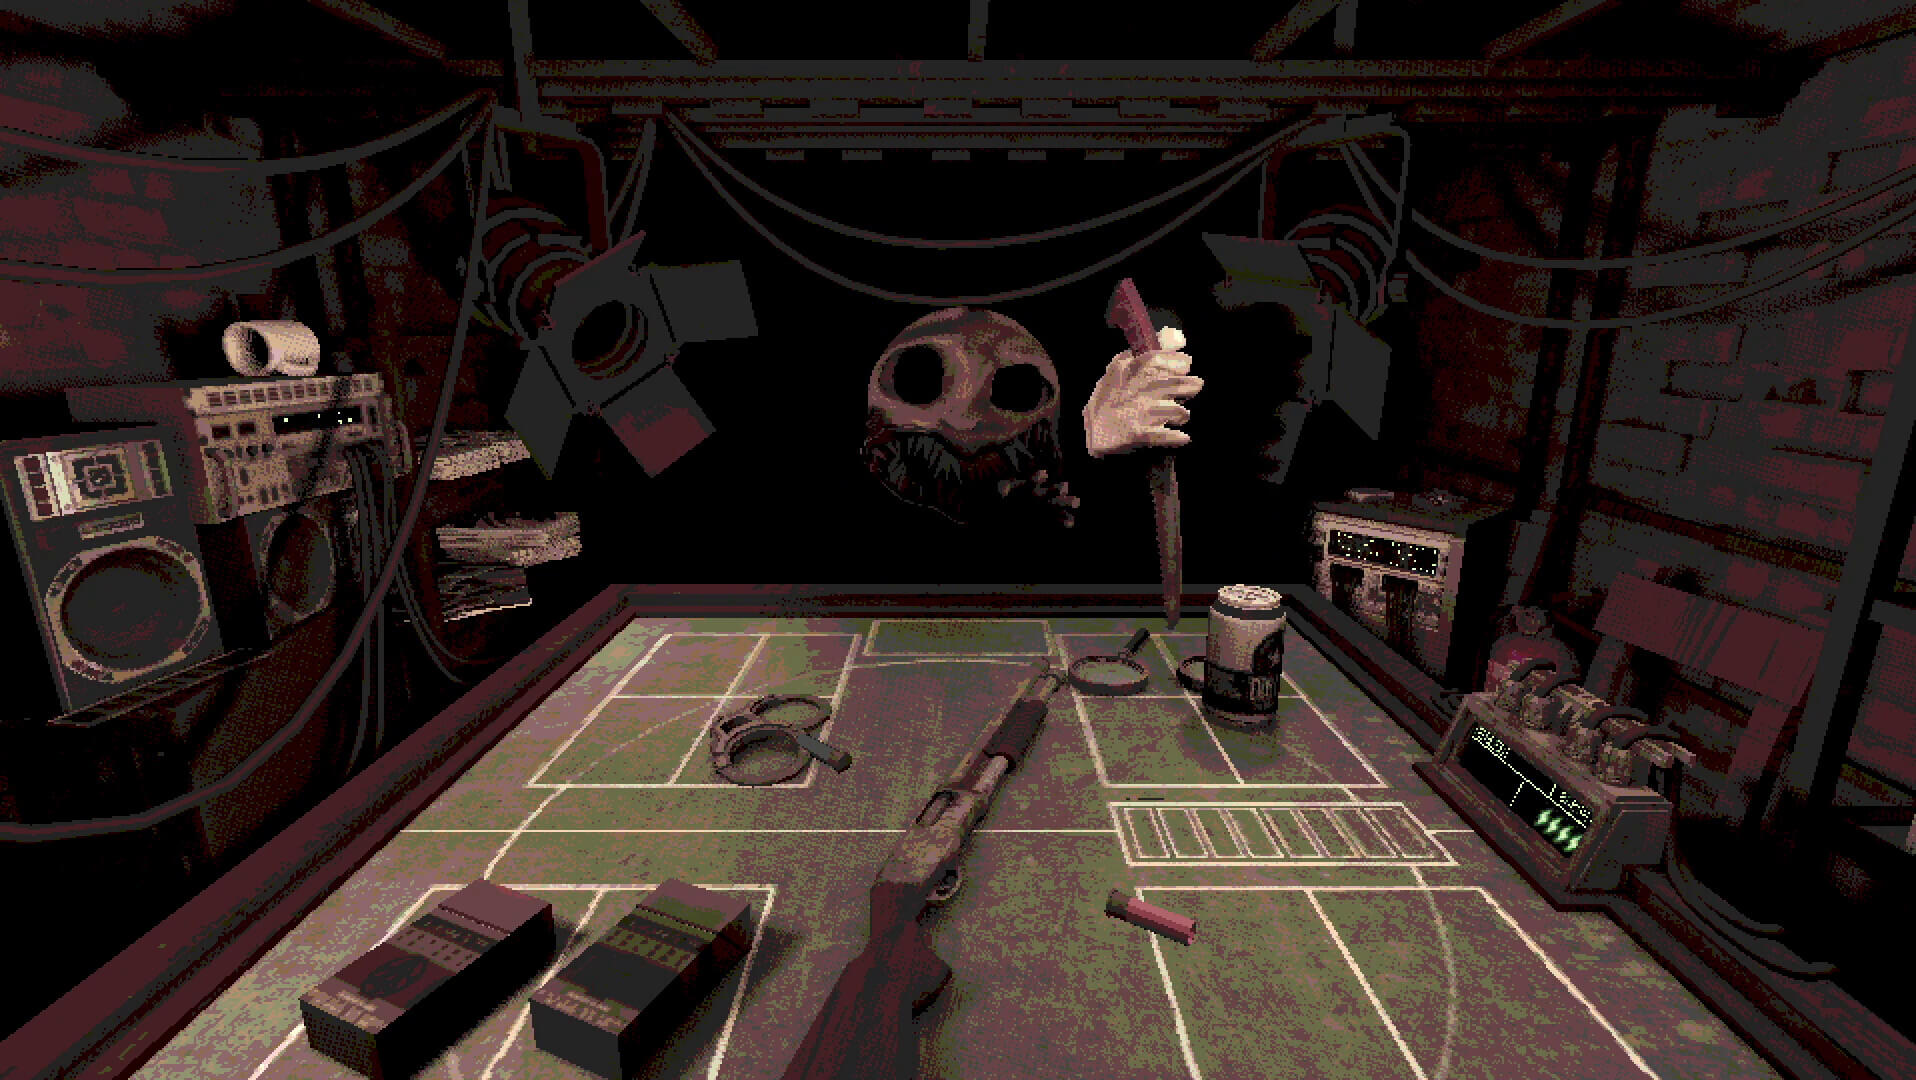 Buckshot Roulette hit a million sales, multiplayer mode in development [...]
[ Source: GamingOnLinux ]
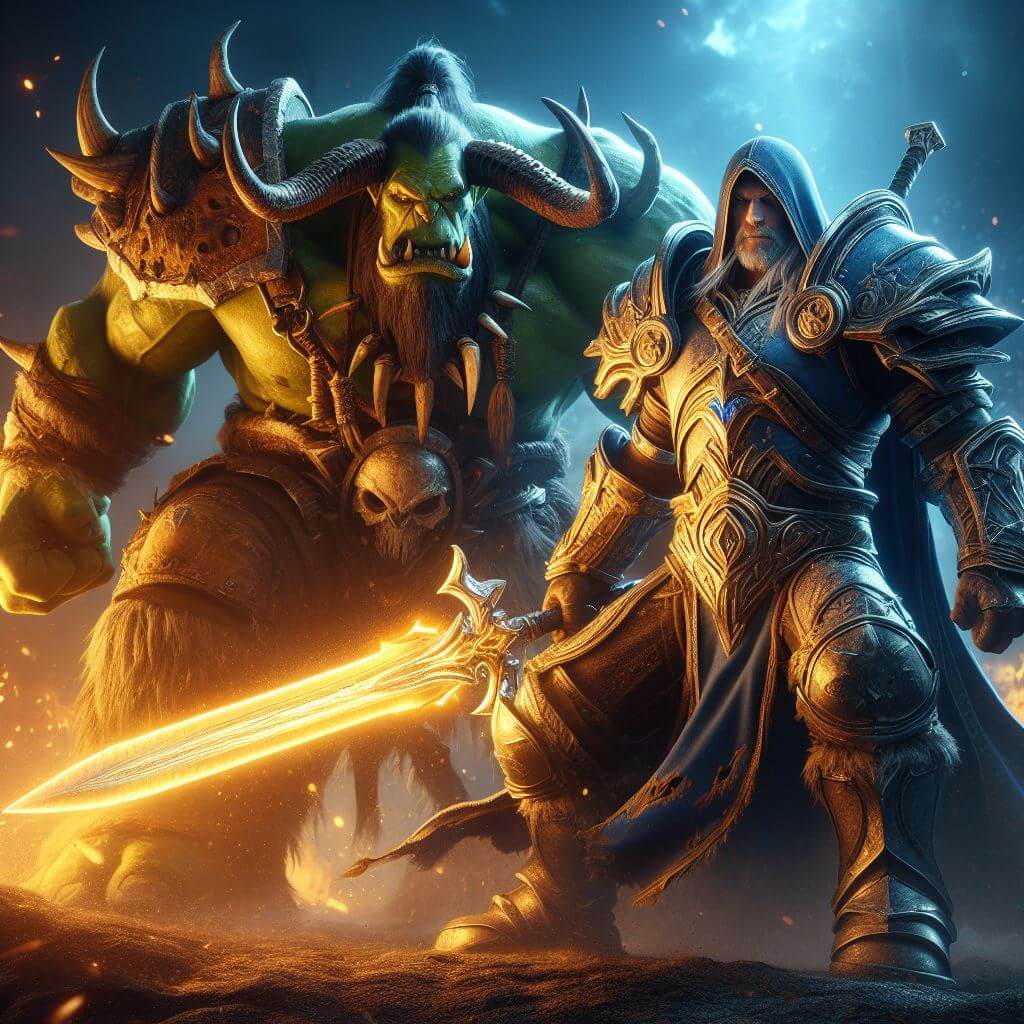 World of Warcraft: The War Within beta testing sign-ups are now open [...]
[ Source: Eurogamer ]
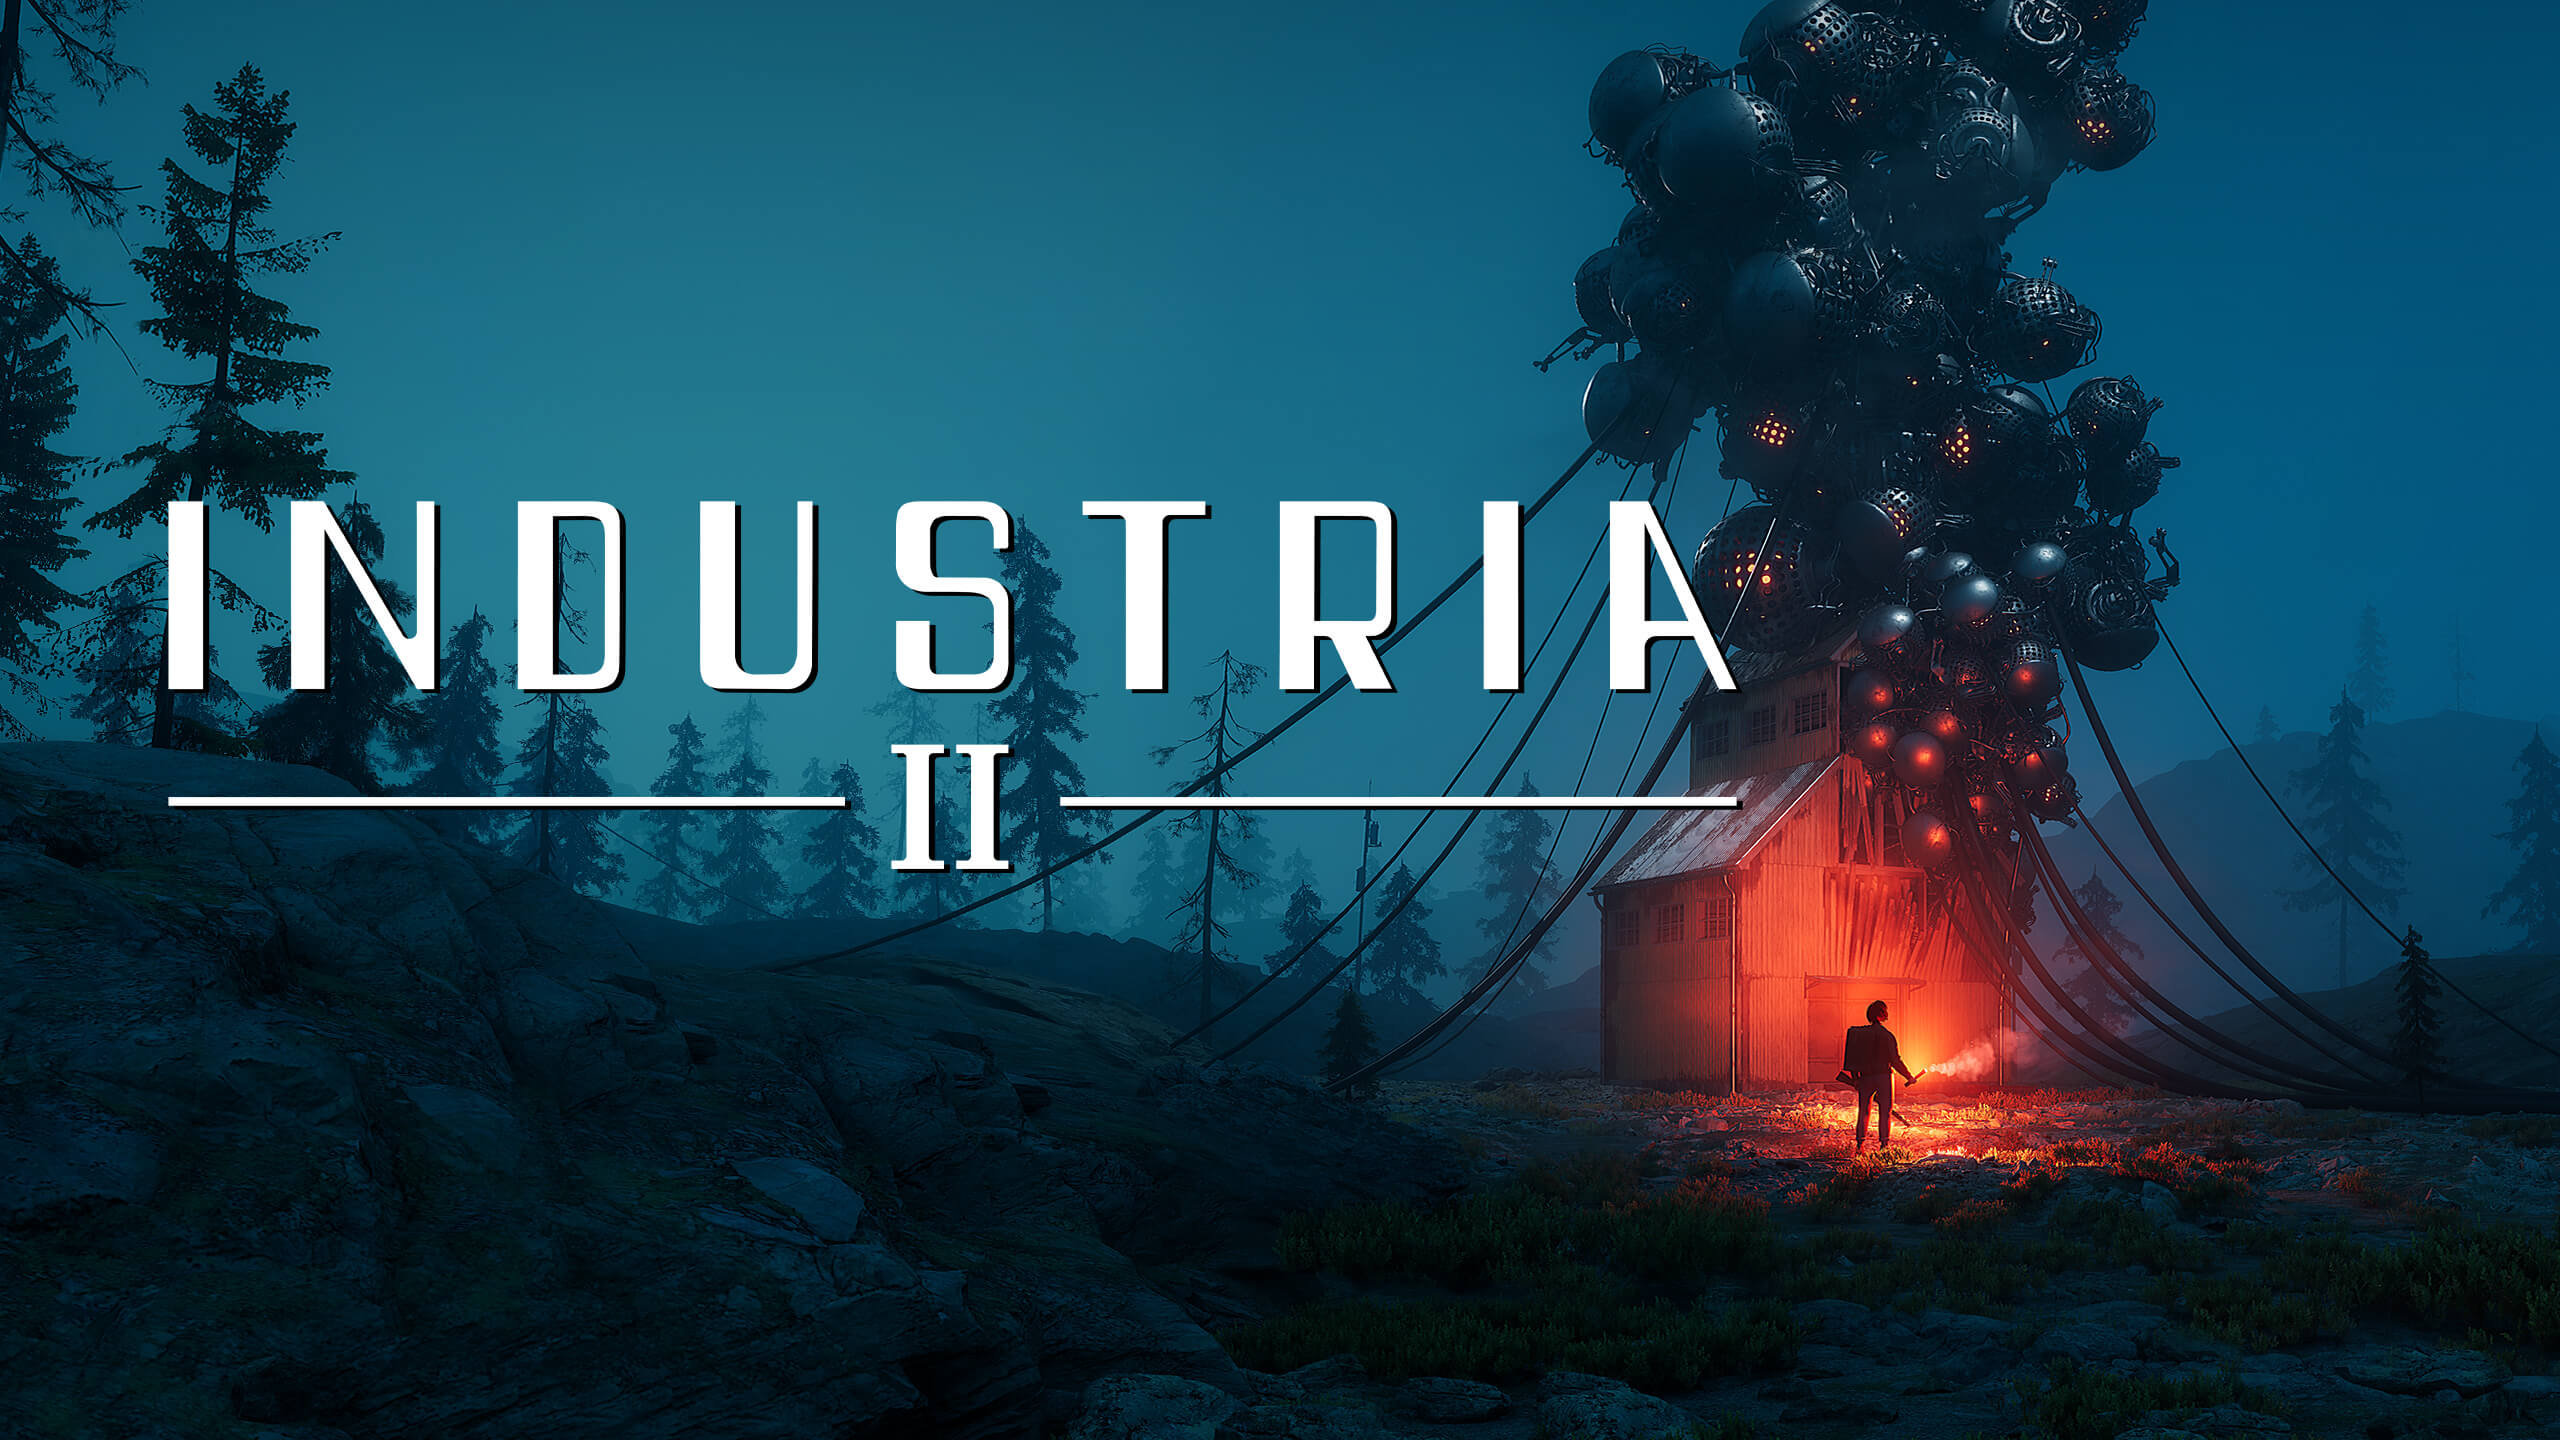 INDUSTRIA II: Everything We Know [...]
[ Source: Gaming Network ]
 Sony Confirms PS Plus Extra & PS Plus Premium Games Leaving In May 2024 [...]
[ Source: PSU ]
TL;DR Gaming News Today
Planet of Lana - The wait is over! The heartfelt journey of Lana & Mui is now available
on Nintendo Switch. For our PlayStation players, your adventure begins at 2pm BST / 3pm CET.
[ Source: GameTikker ]
 What a Possible Xbox Handheld Means for Gaming [...]
[ Source: Sci-Fi 3D ]
 New LoL Empyrean Skins Revealed [...]
[ Source: The Game Haus ]
 New Zenless Zone Zero Character Teaser Stars Koleda [...]
[ Source: Siliconera ]
 EA's Upcoming Ironman Game Confirmed As Open World [...]
[ Source: DualShockers ]
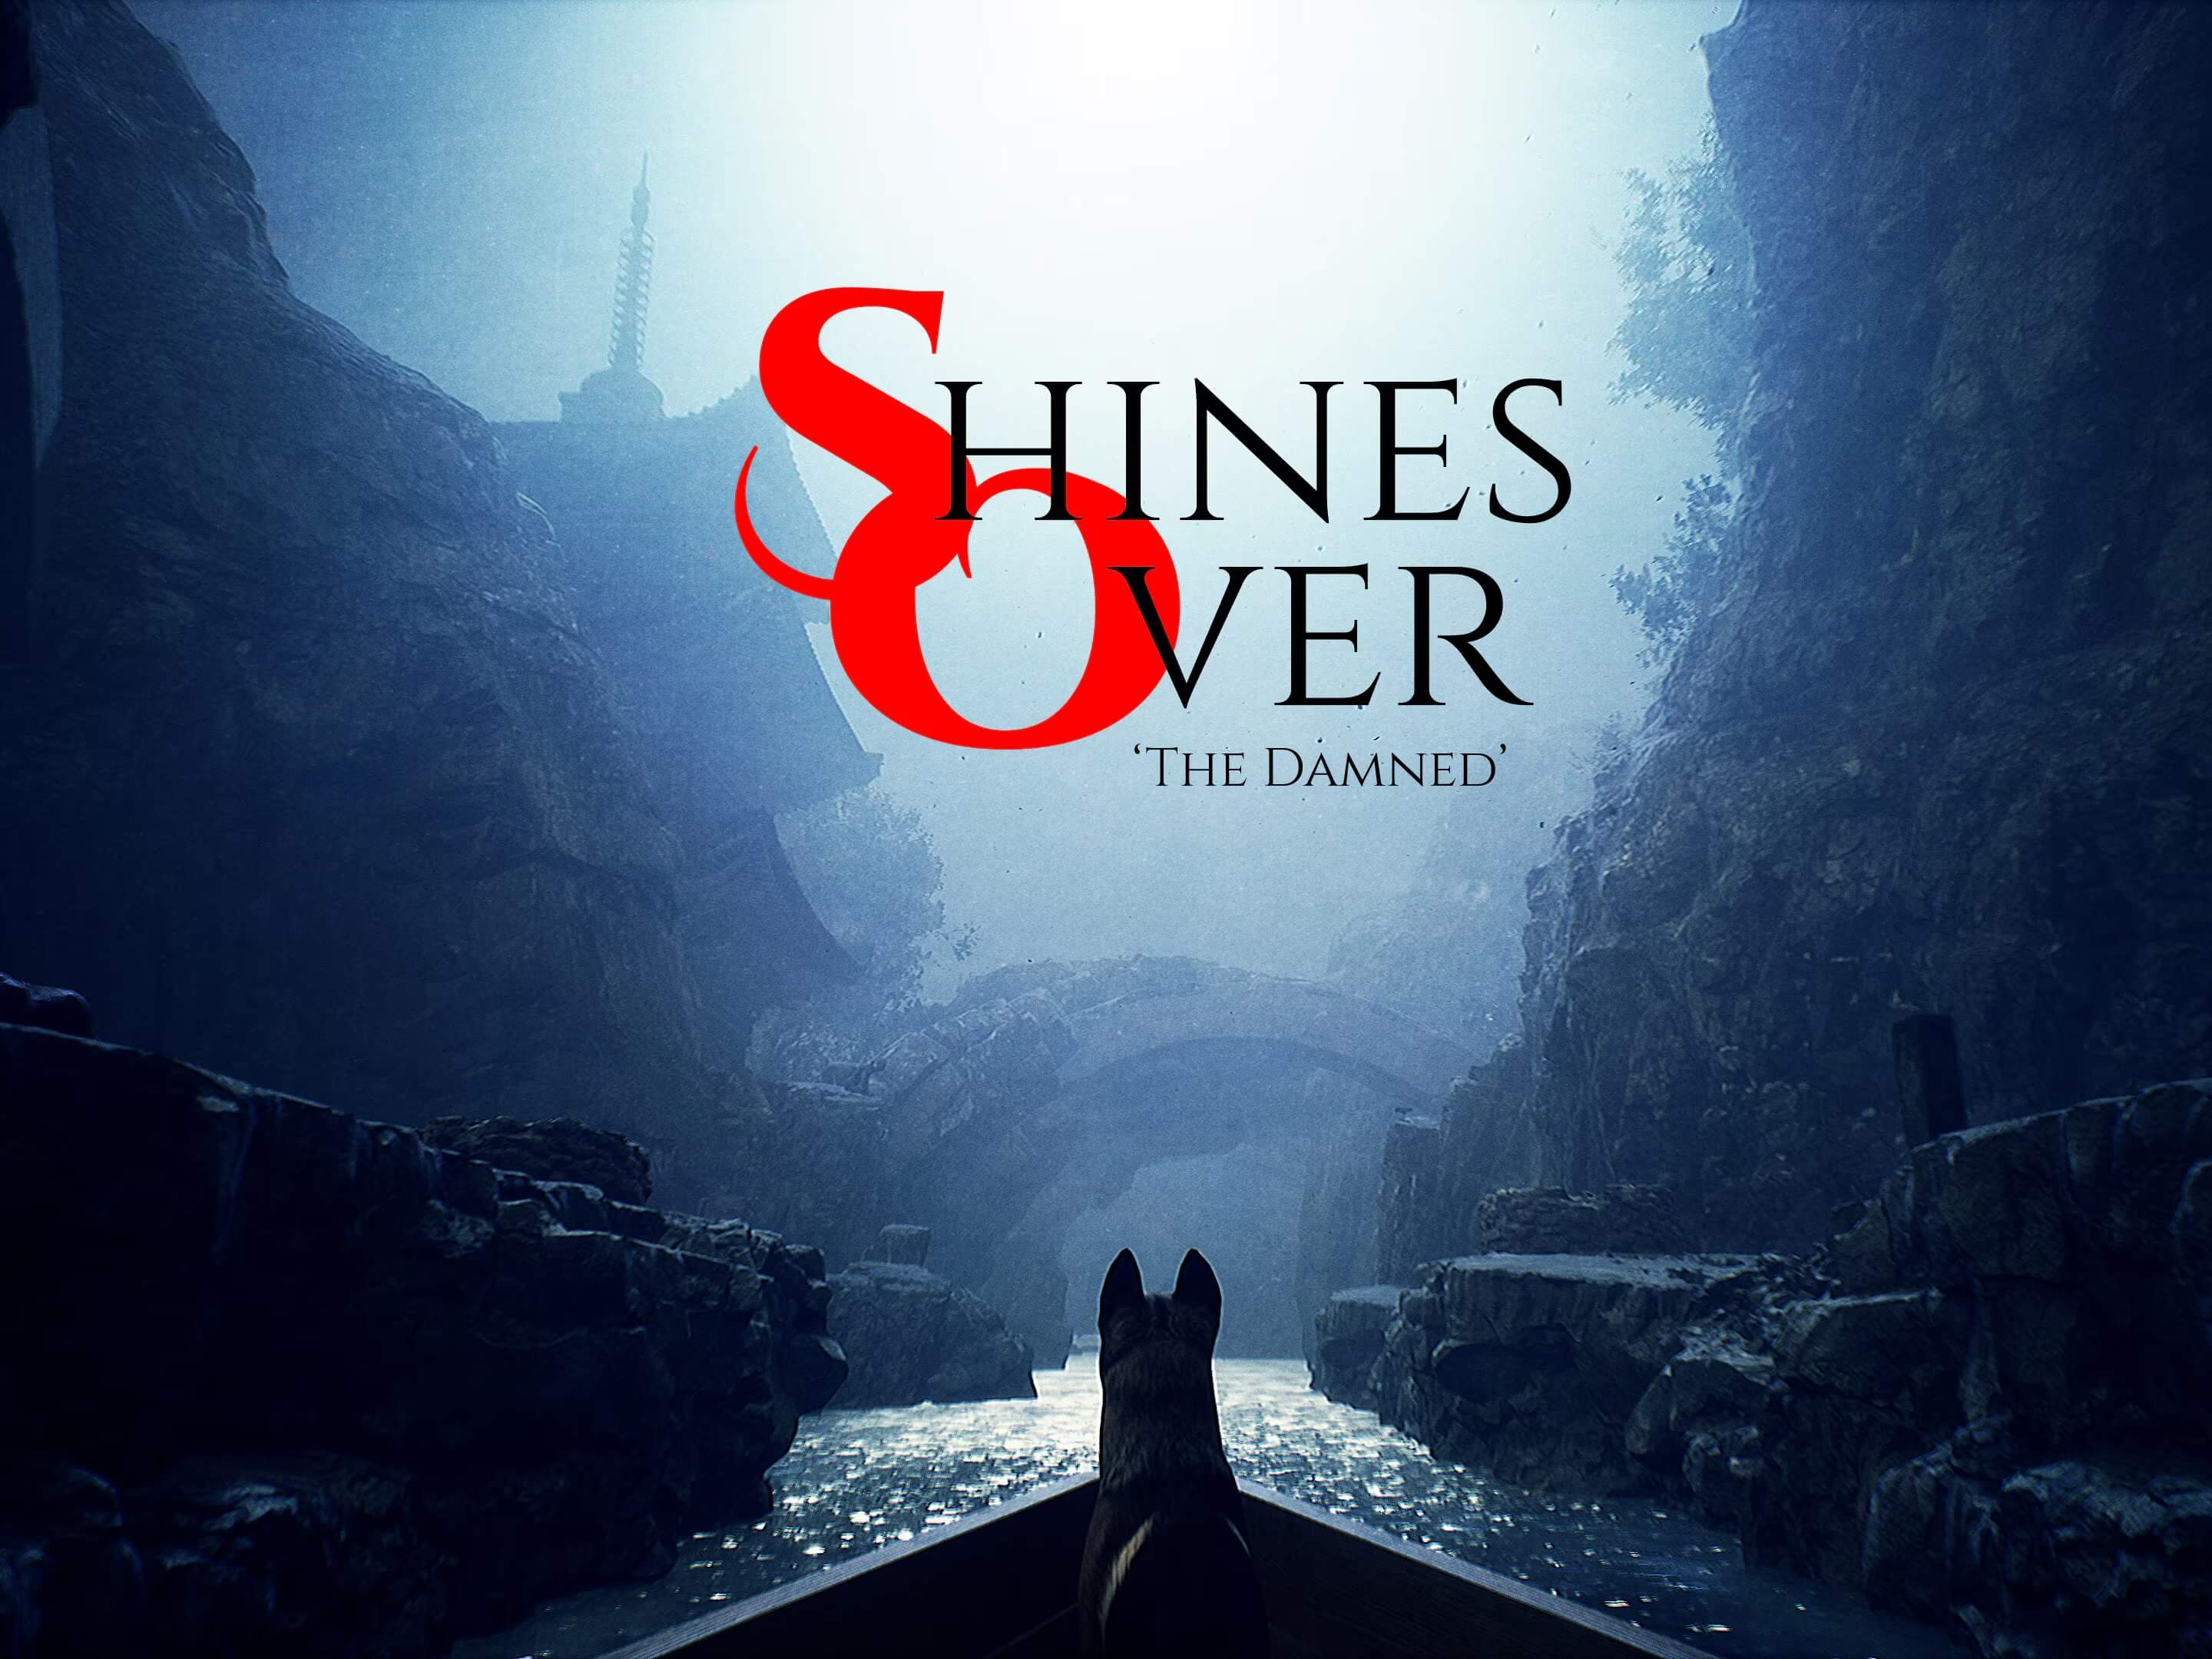 Shines Over: The Damned - PS5 Review [...]
[ Source: thumbculture ]
 Extreme Rally Raid To Release May 23 [...]
[ Source: Race Sim Central ]
TL;DR Gaming News Today
Battlefield - FRONTLINES IS HERE! Push forward. Destroy the objectives.
Hold the line. Play Battlefield 2042 - Season 7: Crimson Front Event NOW!
[ Source: GameTikker ]
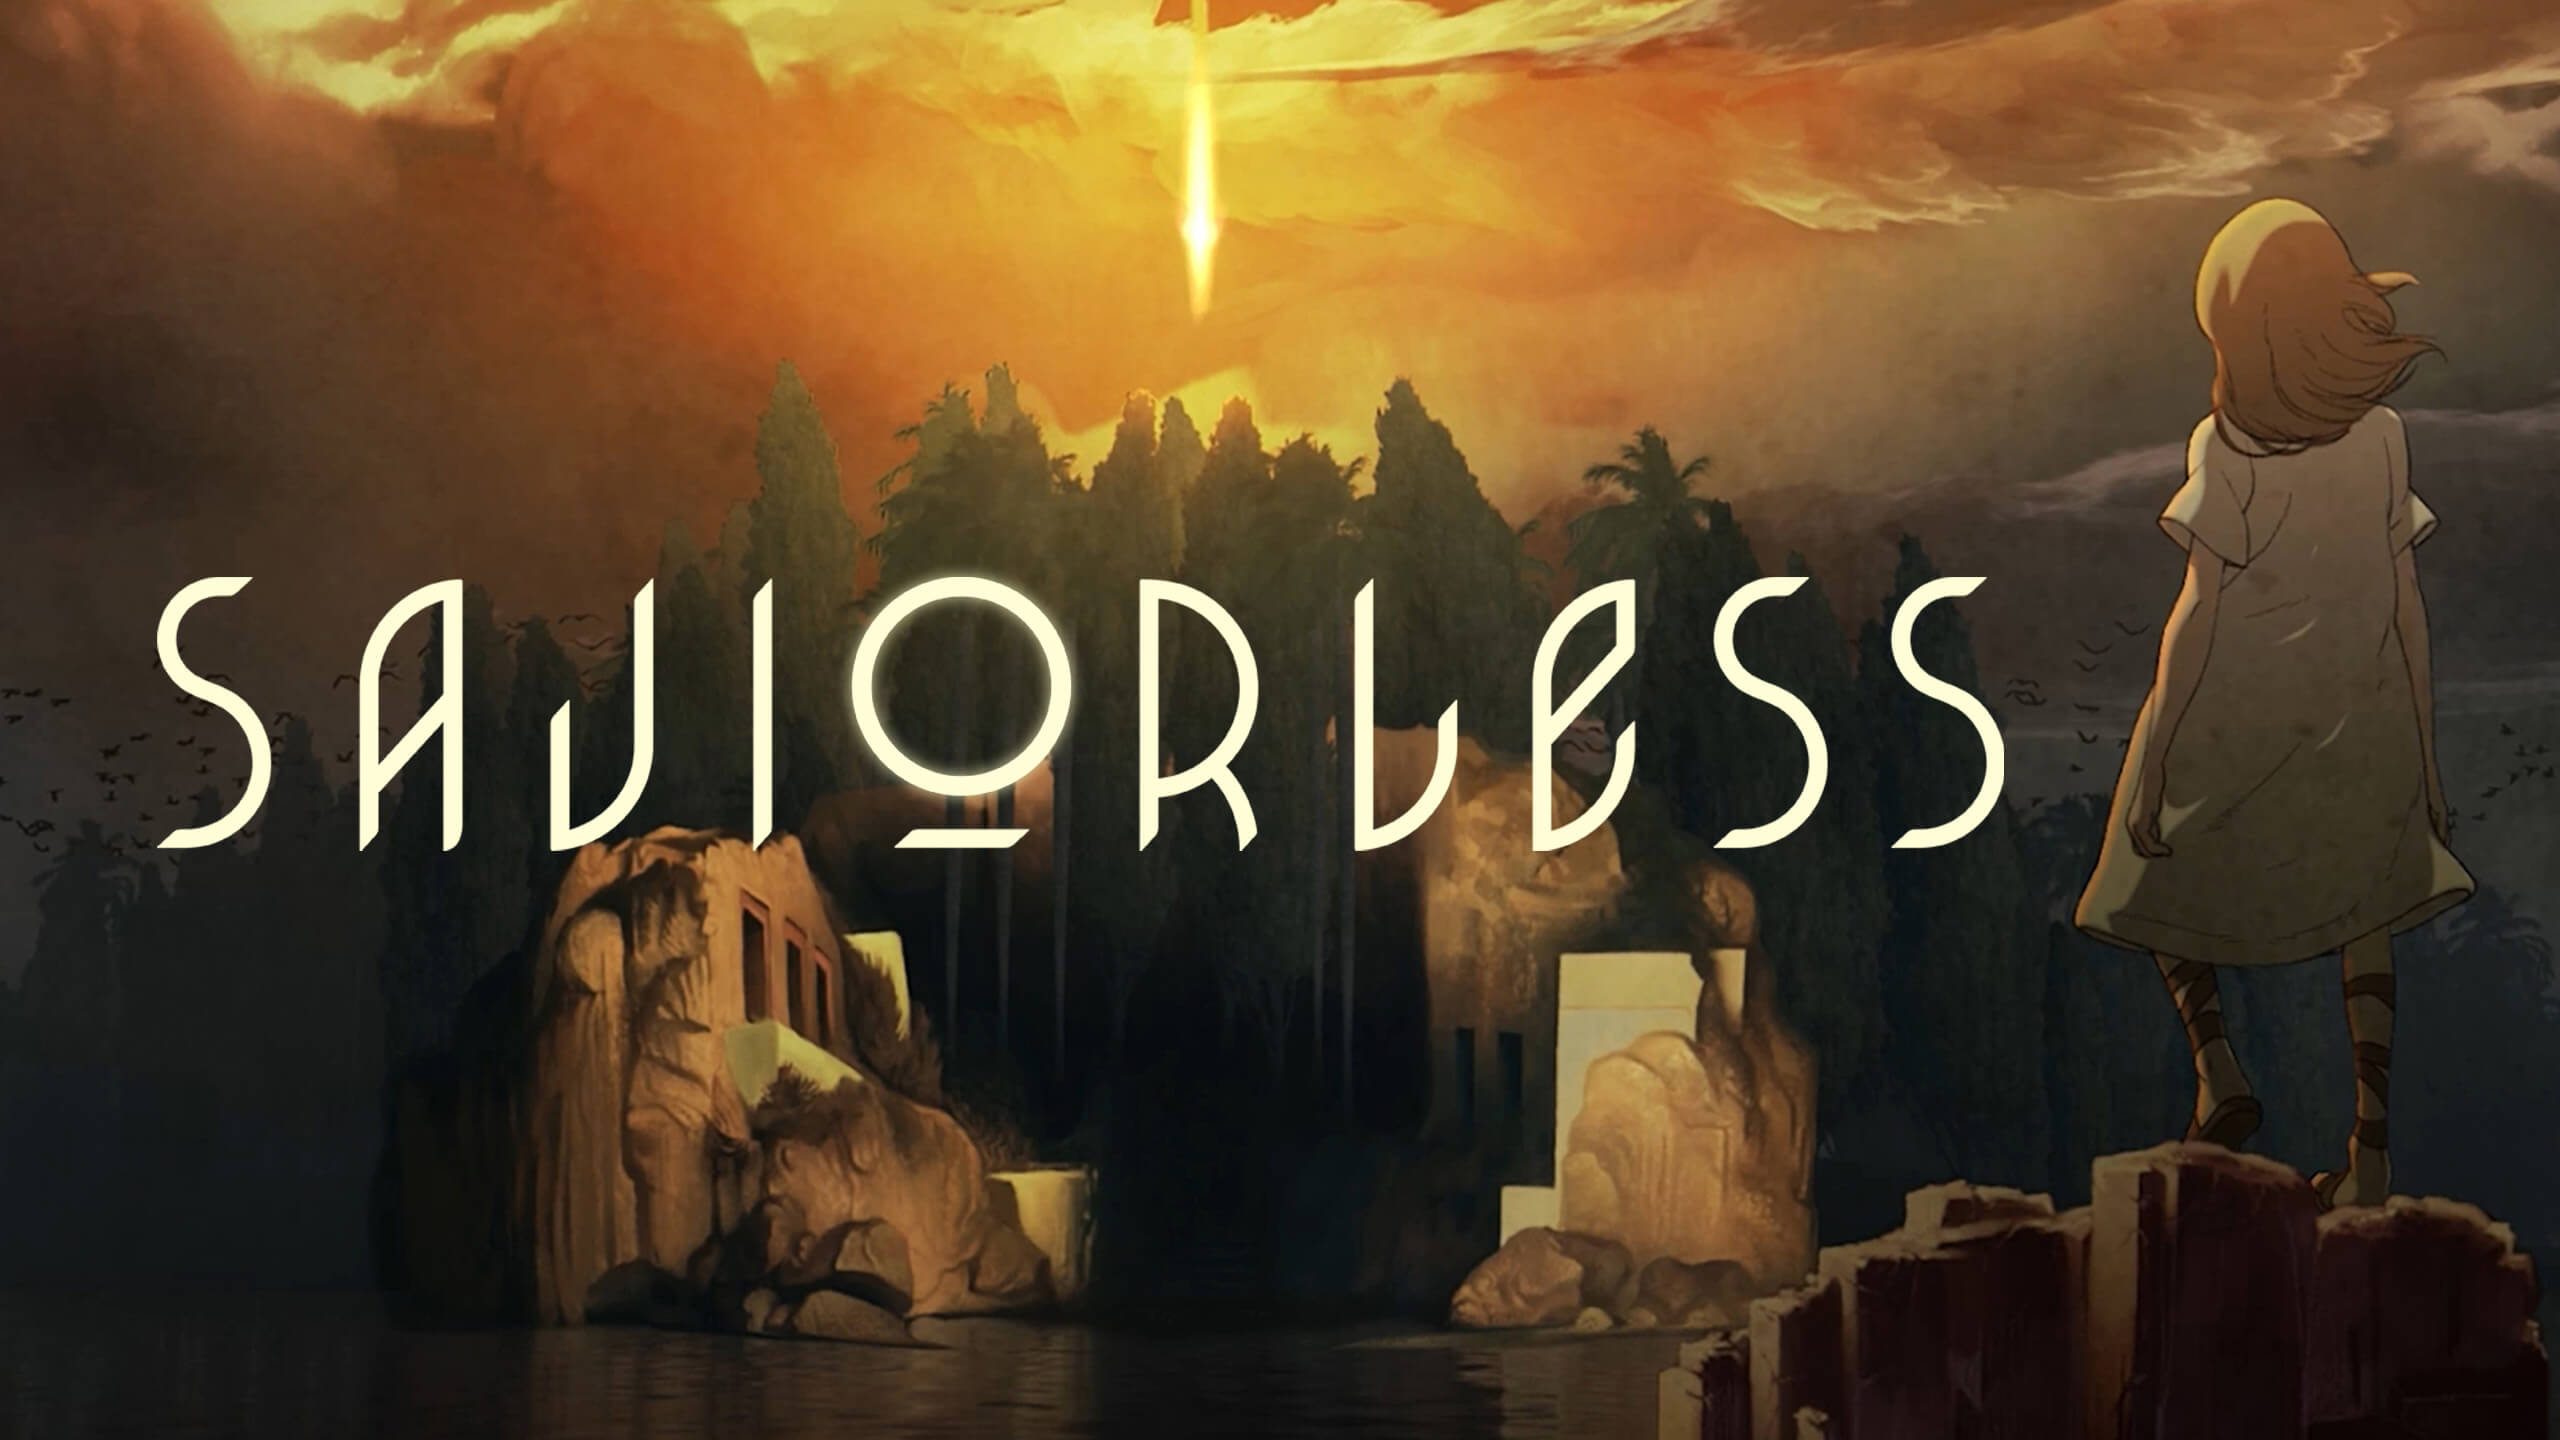 Saviorless (Switch) - Review [...]
[ Source: The Gamers Lounge ]
 Cyberpunk 2077 mod lets you explore Night City with friends [...]
[ Source: GamingBible ]
 This BAFTA-winning indie is now available on PS Plus [...]
[ Source: Dot Esports ]
 EA’s Black Panther game will seemingly be open world [...]
[ Source: GamesHub ]
 “Invincible” AAA Game Crowdfunding Campaign Launched by Skybound [...]
[ Source: MP1st]
 The Most Devastating Game Cancelations Of 2024 So Far [...]
[ Source: SVG ]
TL;DR Gaming News Today
WARFRAME - The TennoCon 2024 Merch Pack is now available! Featuring iconic Warframe: 1999 artwork, it’s the
perfect way to let everyone know that you were there (in-person or online) during this year’s biggest reveals.
[ Source: GameTikker ]
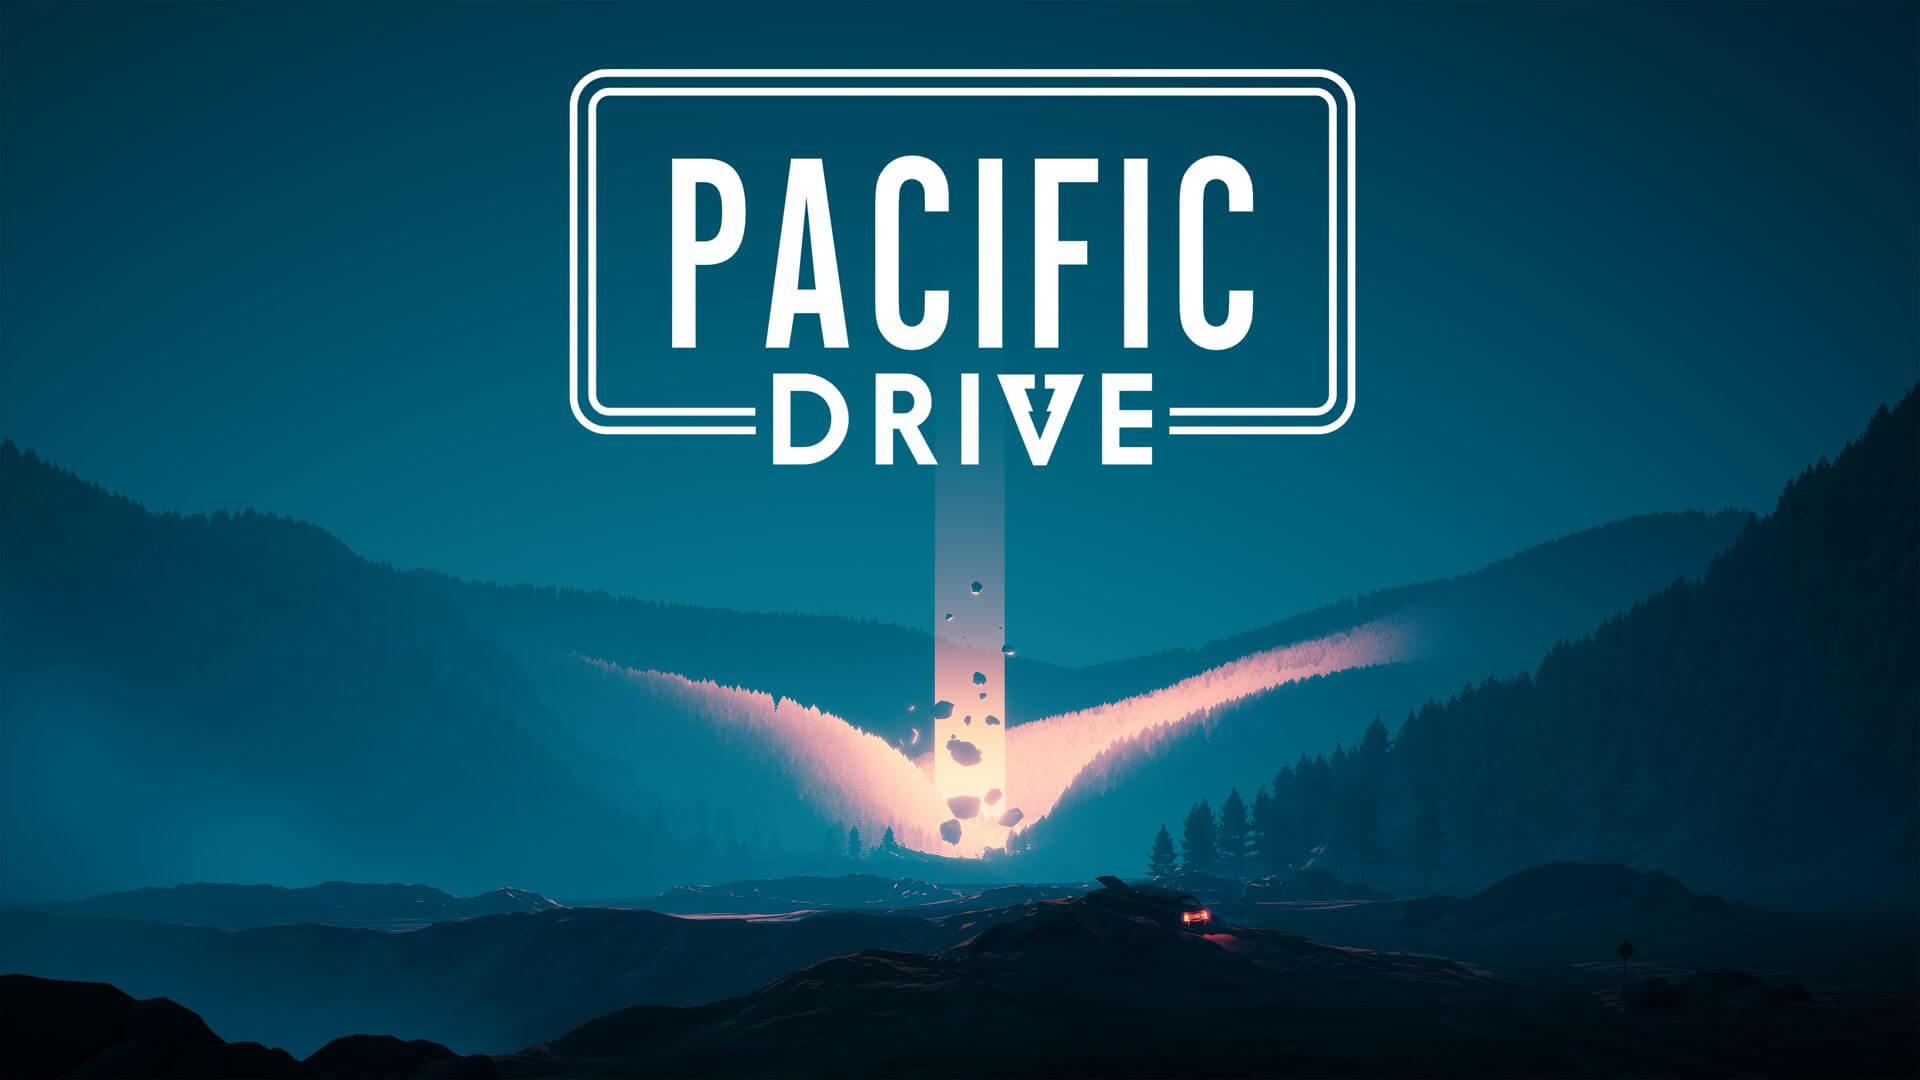 Steering Into Mysterious Adventure in Pacific Drive - Review [...]
[ Source: GiN ]
 Everyone’s Favourite Top-Down Shooter Is Heading to PlayStation This Summer - Get Ready to Get Blood-Soaked [...]
[ Source: FandomWire ]
 Spyro Reignited Trilogy might be coming to Game Pass soon [...]
[ Source: XboxEra ]
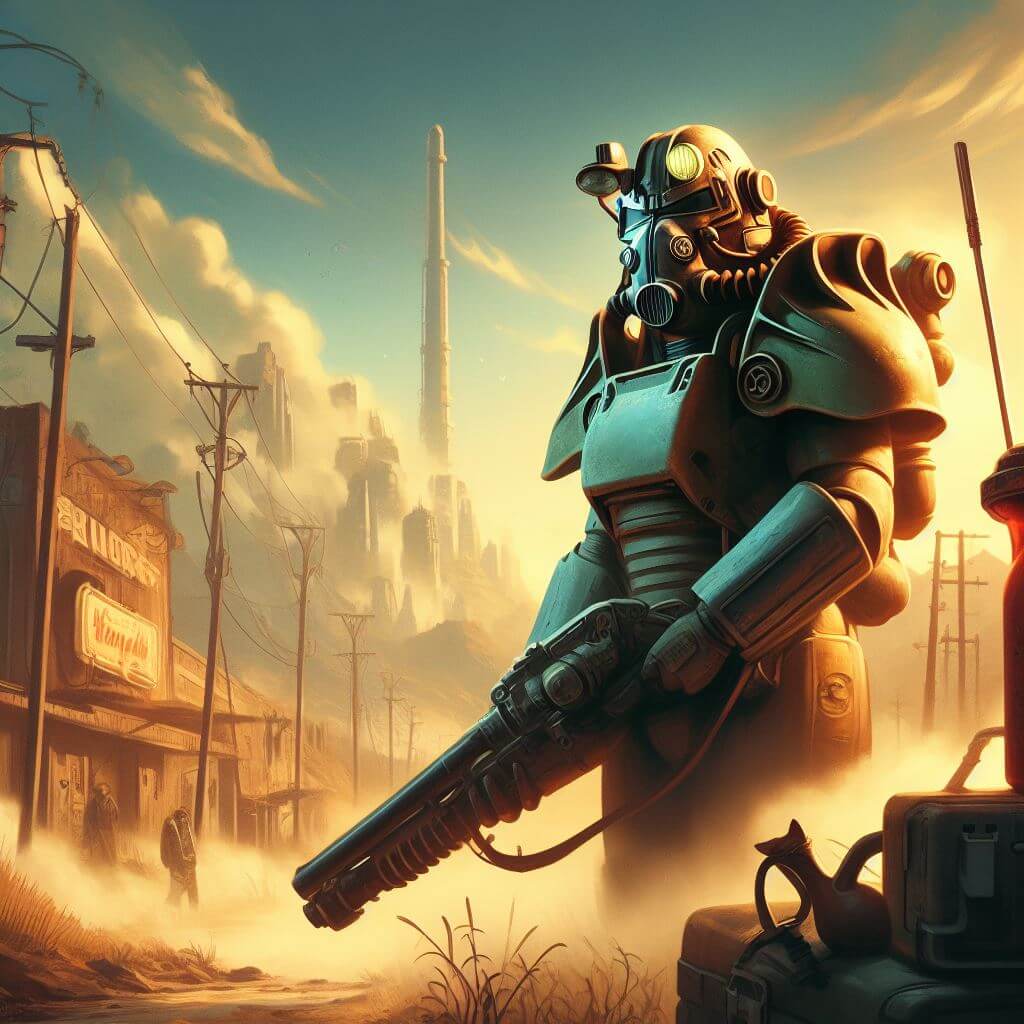 Fallout 76 Is Now Free to Grab on Prime Gaming for PC and Xbox [...]
[ Source: Wccftech ]
 Harold Halibut - Review [...]
[ Source: TheXboxHub ]
 Forza Motorsport Update 7 Available [...]
[ Source: Bsimracing ]
TL;DR Gaming News Today
PlayStation - A sandstorm is coming... Join Prince Beelzebub in search
of the Legendary Spring in Sand Land, coming April 26 to PlayStation.
[ Source: GameTikker ]
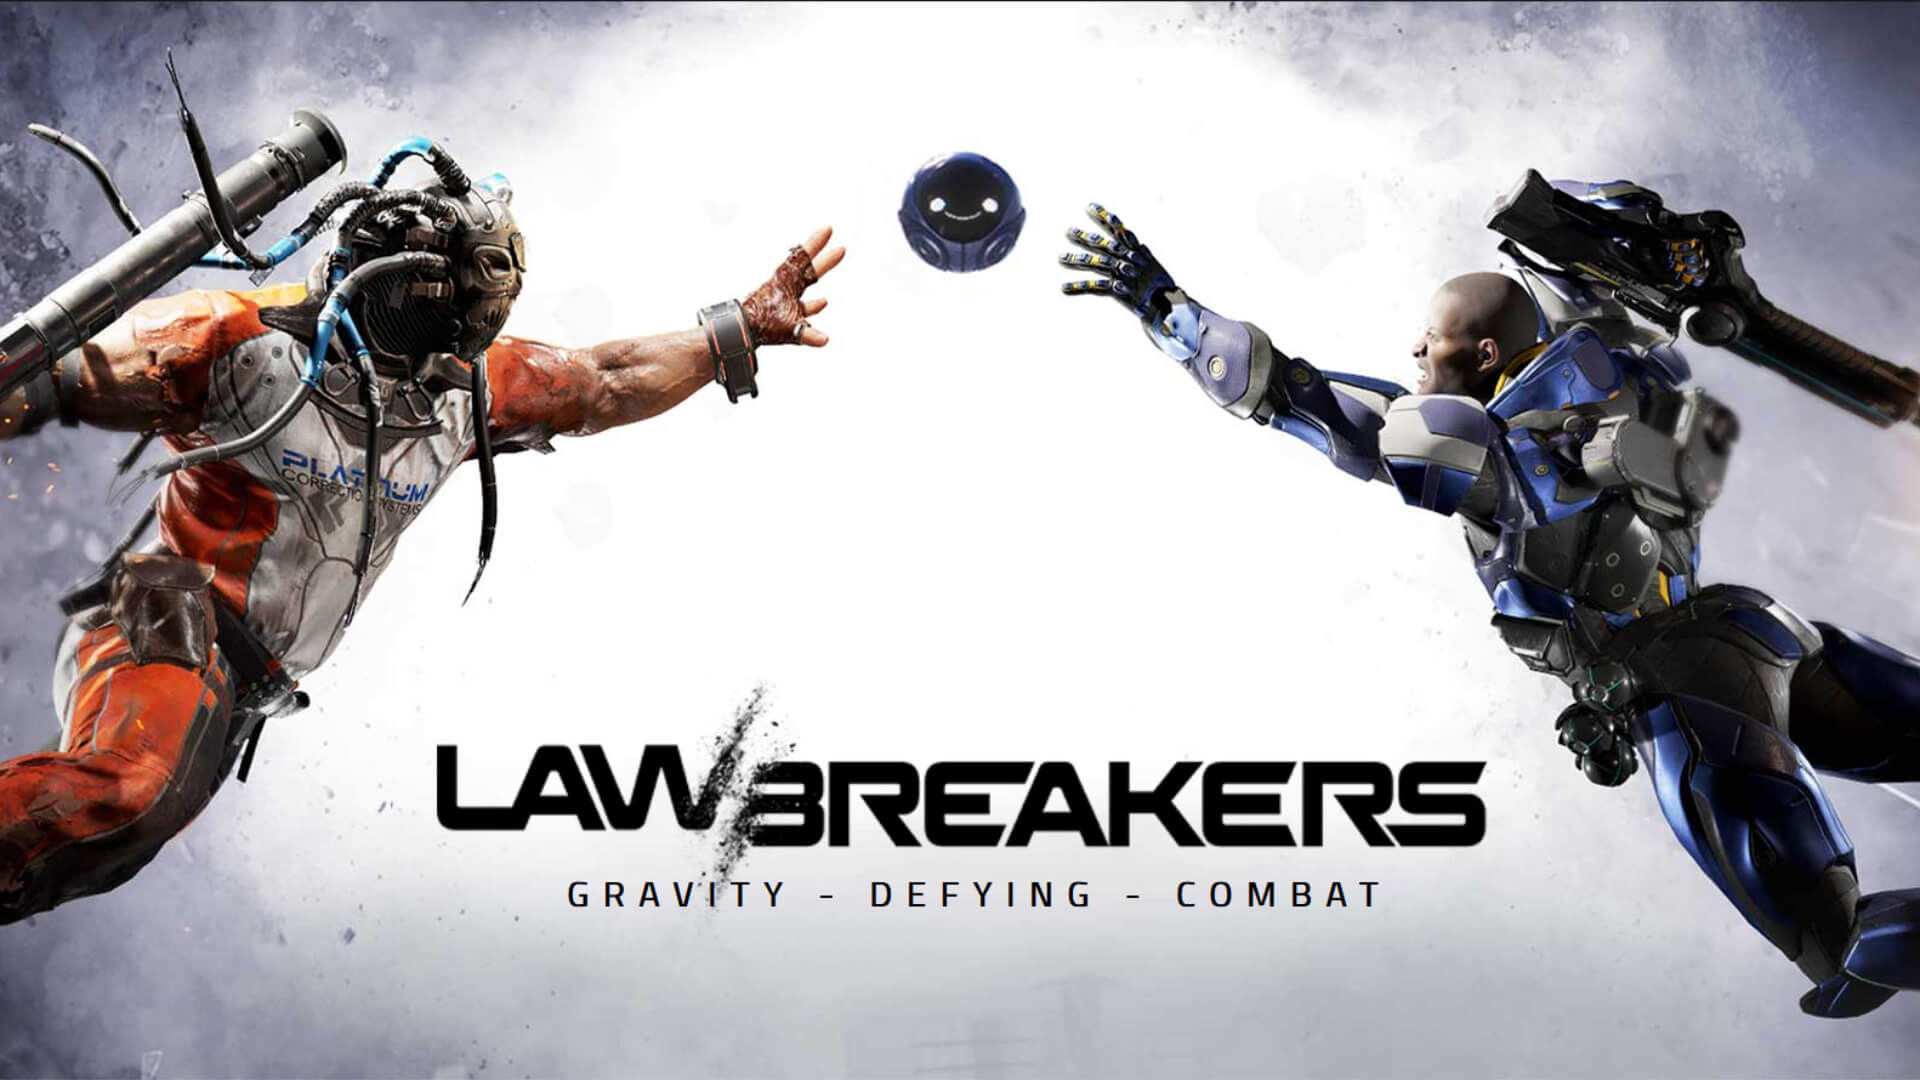 Cliff Bleszinski's LawBreakers is back from the dead [...]
[ Source: Gamereactor ]
 Dive into nostalgia with this Analogue Pocket handheld console deal [...]
[ Source: Stealth Optional ]
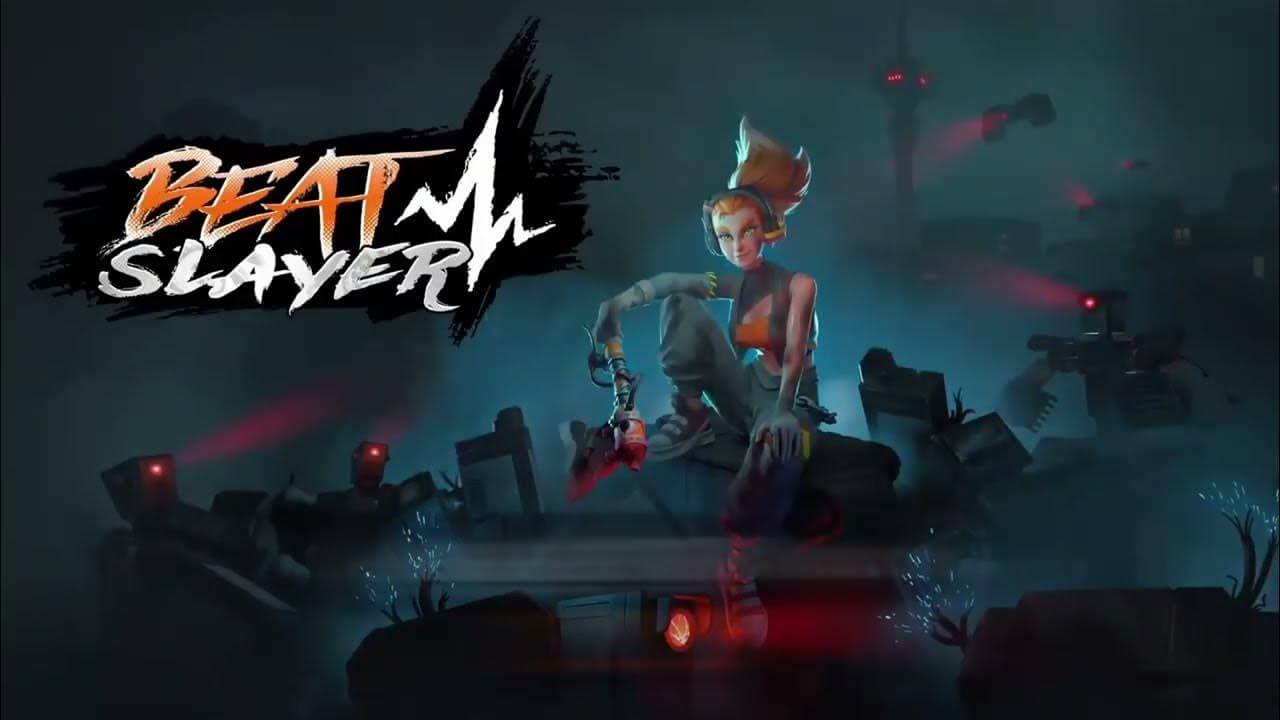 Beat Slayer - Review (PC) [...]
[ Source: Softpedia ]
 The Planet Crafter Steam Deck Performance [...]
[ Source: Games in Hand ]
 ‘Catch My Drift’ Humble Bundle Includes Indie Greats And Off-Road Titles [...]
[ Source: OverTake ]
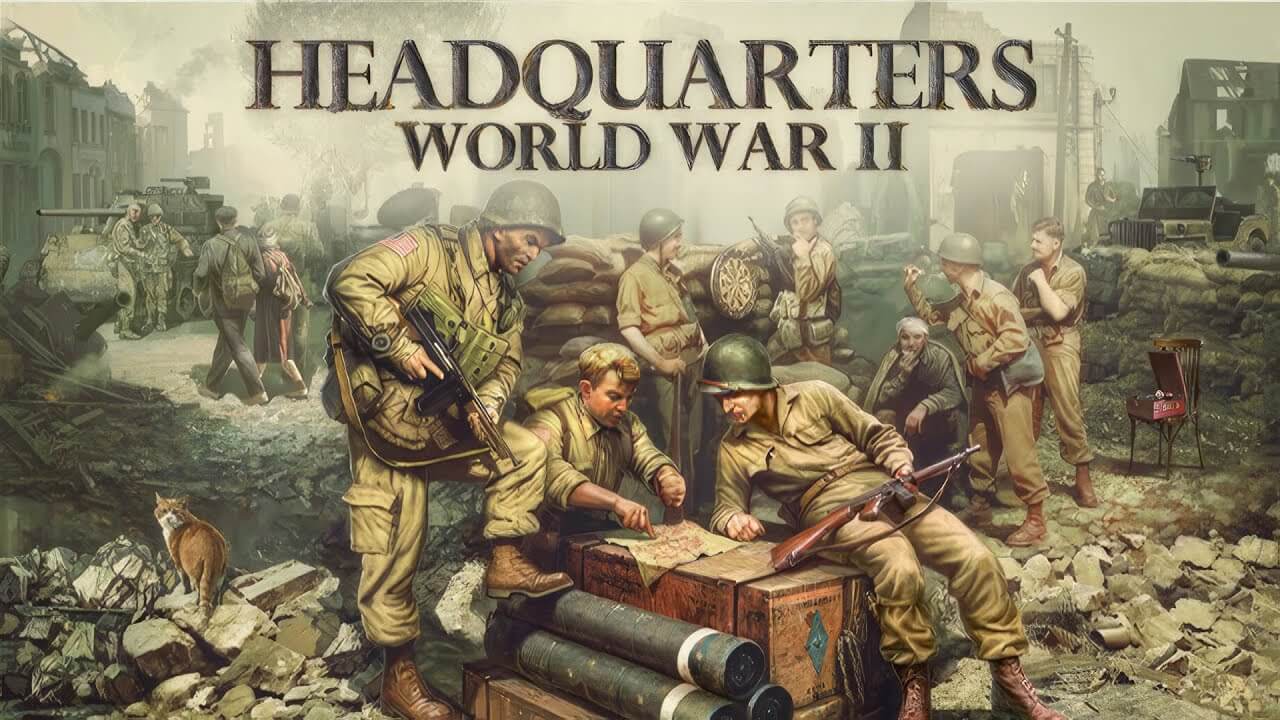 Headquarters: World War II - Metacritic Score [...]
[ Source: Metacritic ]
TL;DR Gaming News Today
Flatline Studios - Into The Grid is the ultimate Cyberpunk Deckbuilder & Tabletop hybrid,
mixing immersive card battles and tactical map exploration! Wishlist today & join the playtest!
[ Source: GameTikker ]
 The Development of Star Trek: Infinite Has Ended [...]
[ Source: GameGrin ]
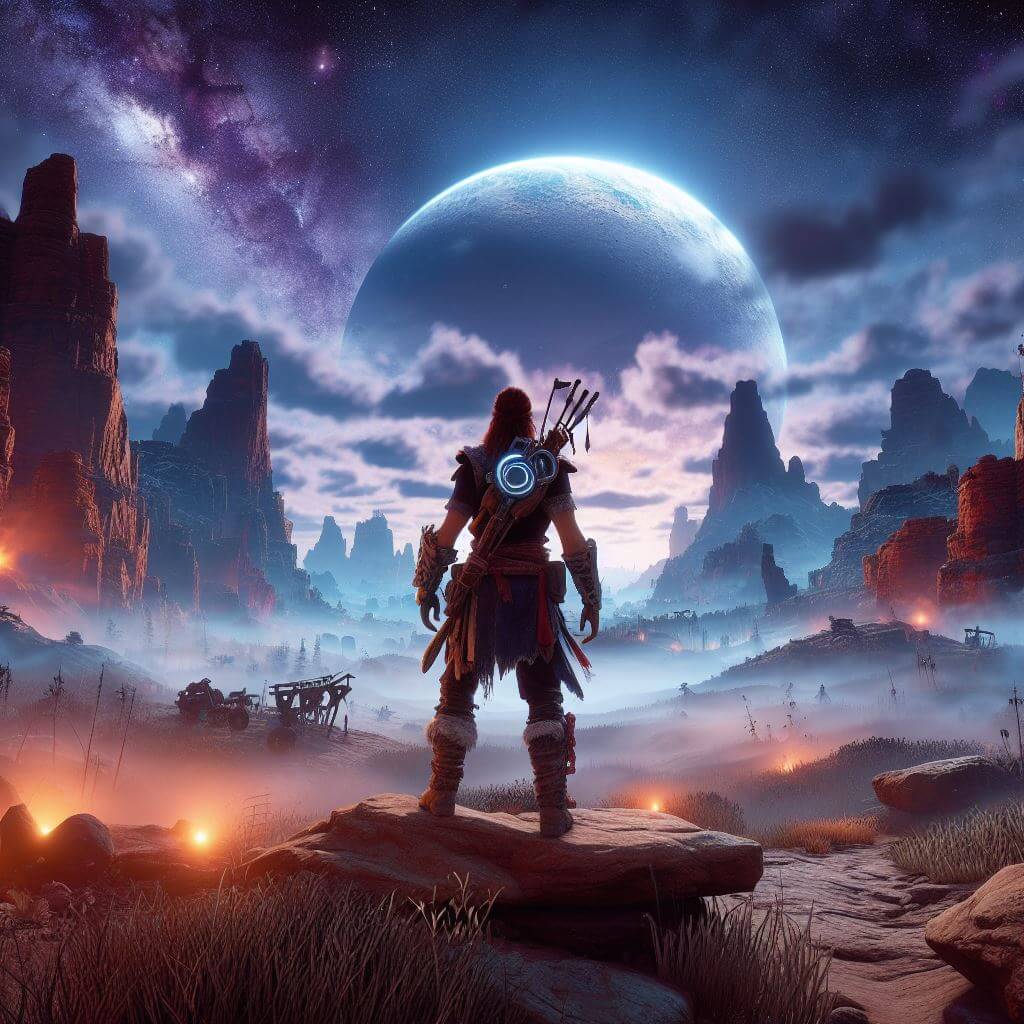 Horizon Forbidden West Complete Edition PC - Review [...]
[ Source: Impulse Gamer ]
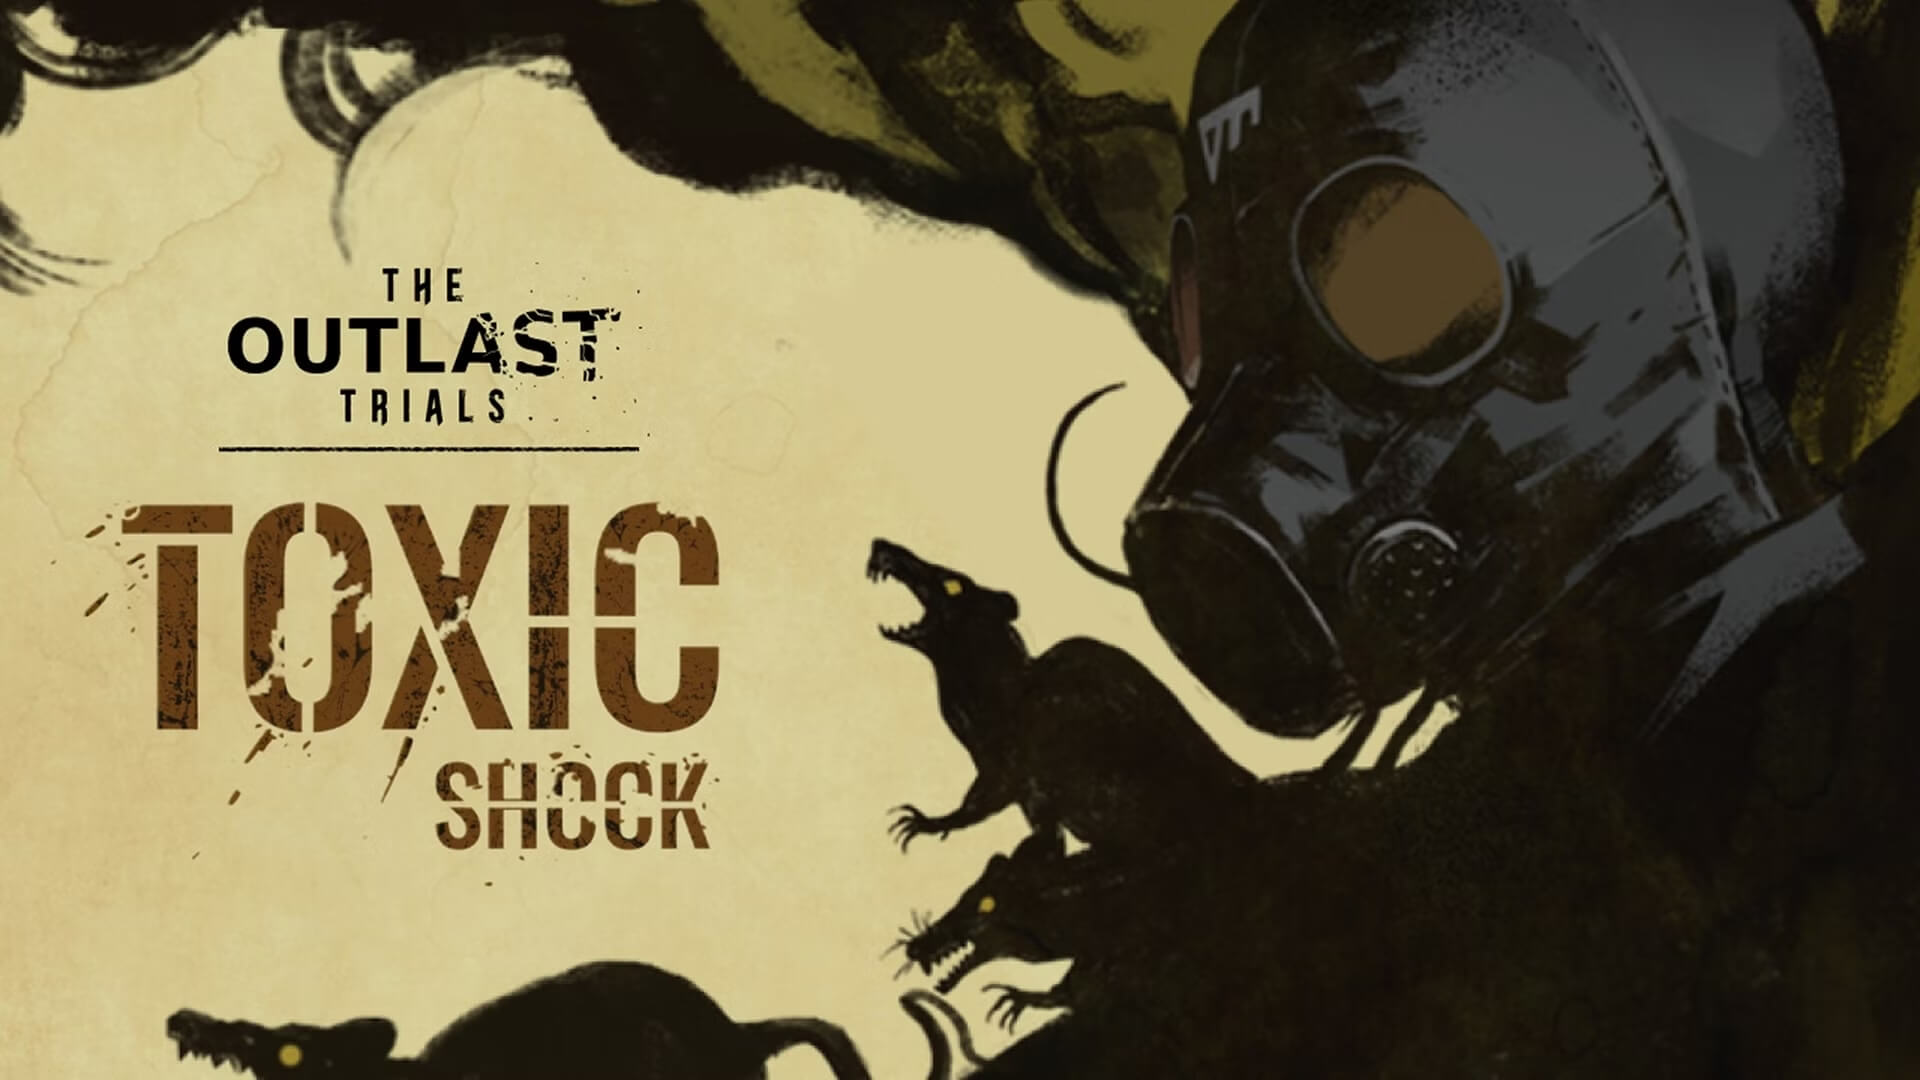 The Outlast Trials Gets New Limited-Time Event with Toxic Shock Update [...]
[ Source: Hey Poor Player ]
 All Mobile Games (Android and iOS) releasing in April 2024 [...]
[ Source: GamingonPhone ]
 The Epic Games Store Weekly Freebie was a Run Away Hit [...]
[ Source: Terminal Gamer ]
 Creating value for fans and brands at TwitchCon Europe [...]
[ Source: Esports Insider ]
TL;DR Gaming News Today
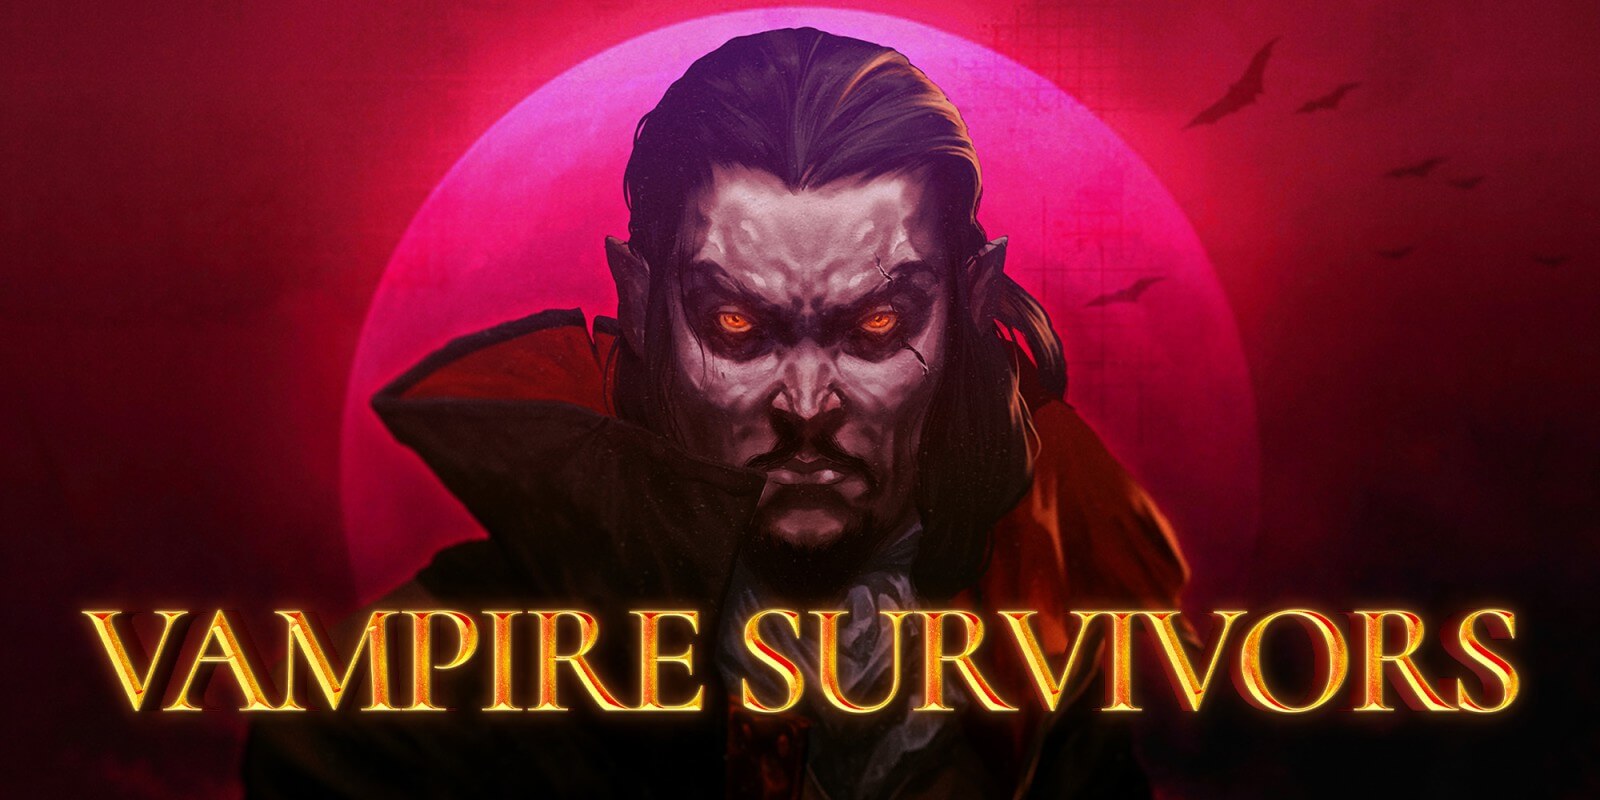
Contra - You heard that right! Vampire Survivors x Contra DLC is coming to Steam, Xbox, Nintendo Switch & mobile May 9th! 11
new characters. 22 new weapons. 1 new massive stage. 1 new challenge stage. 6 new music tracks. Get ready to Garlic and Load!
[ Source: GameTikker ]
 Square Enix Updates Final Fantasy VII Remake Part 3's Potential Release Window [...]
[ Source: CBR ]
 EA Shuts Down Dead Space 2 Remake Rumors After Reports Indicate It Was Shelved [...]
[ Source: Game Informer ]
 Epic is sending a item to Fortnite players for free, here is why [...]
[ Source: VideoGamer ]
 Nintendo Switch emulator Suyu is dead, probably for real now [...]
[ Source: overkill wtf ]
 The Goonies on Commodore 64 - Review [...]
[ Source: GamesNostalgia ]
 The Sea of Thieves beta has launched on PS5 [...]
[ Source: VGC ]
TL;DR Gaming News Today
Purple Brick Games - Still Joking: Interactive fiction / visual novel. World of mirror reflections. Sarcastic main heroine. Mystery
of her "prototype`s" death. Lots of text. Choices with consequences. Fully voiced cat. Release in May 2024, Wishlist now on Steam!
[ Source: GameTikker ]
 Fallout 3 And Fallout New Vegas Come Free On Amazon Luna [...]
[ Source: Skewed & Reviewed ]
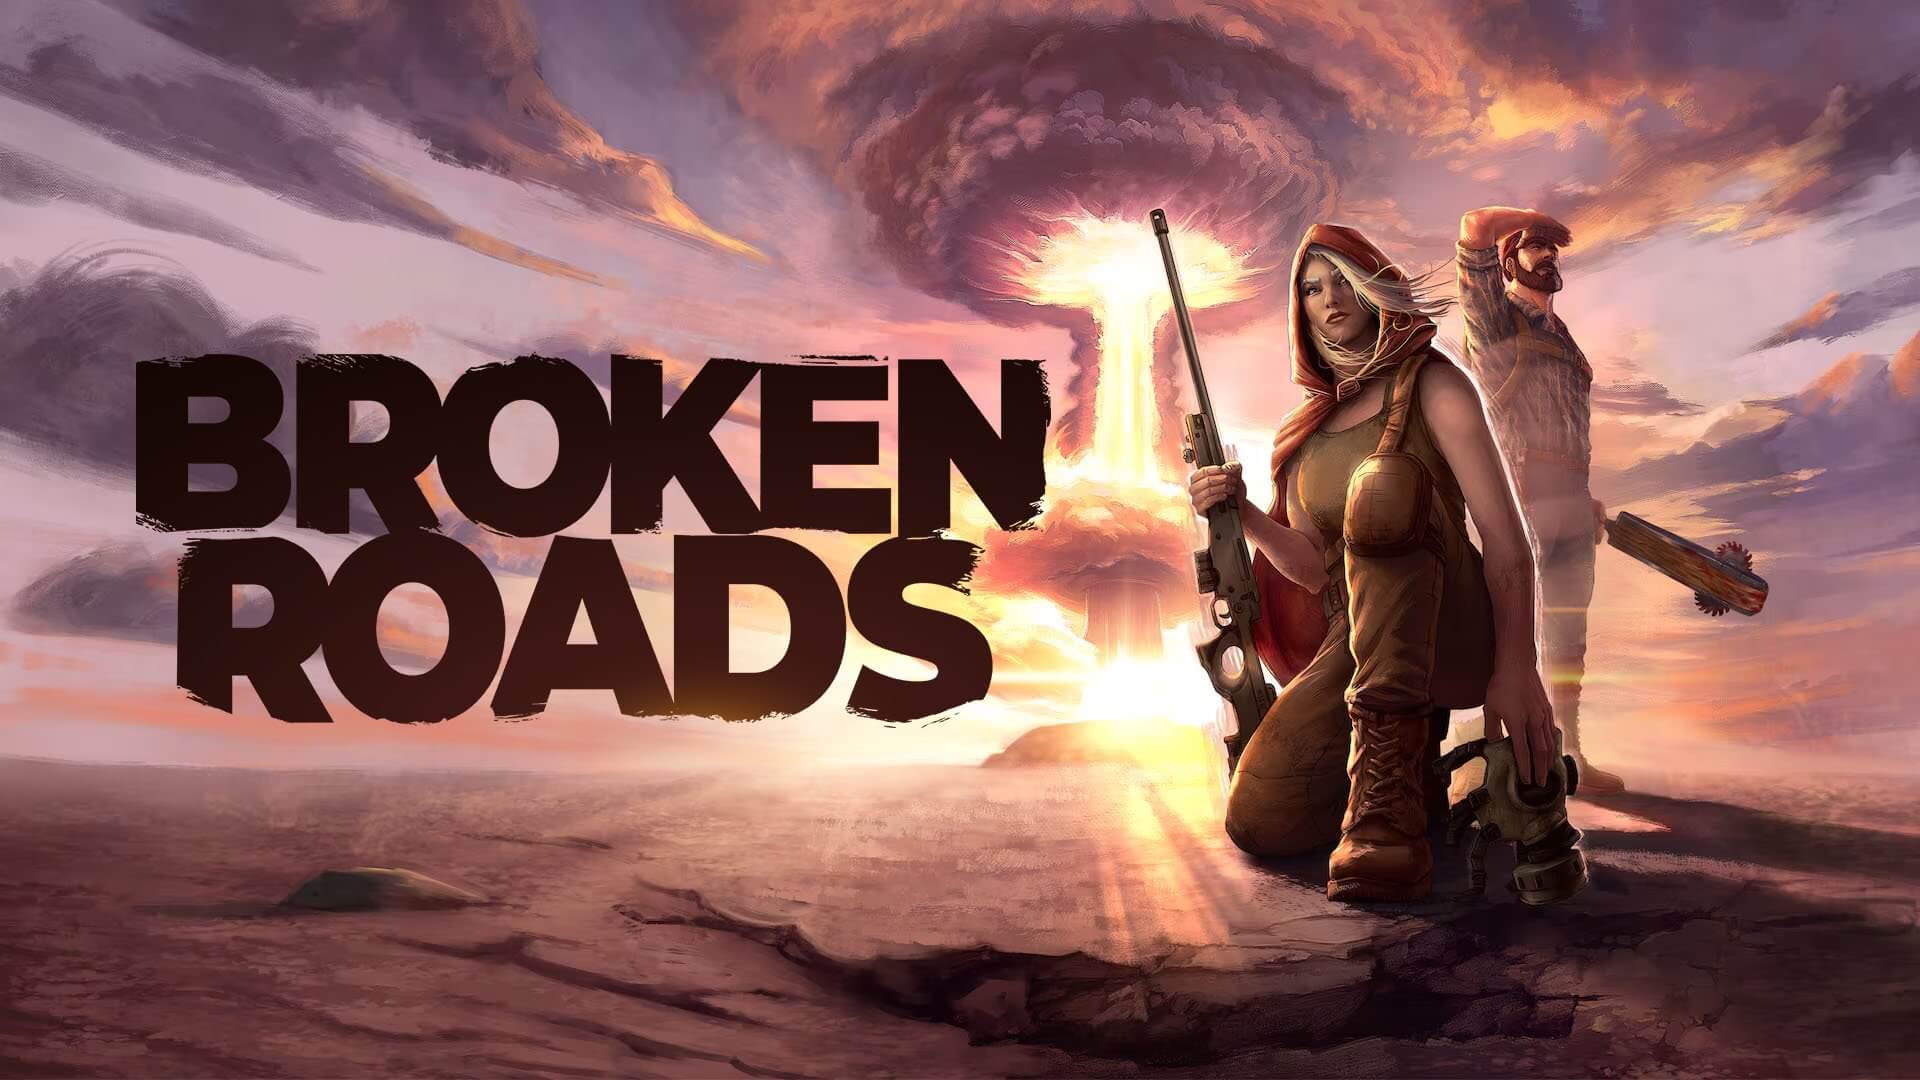 Broken Roads Drives onto Consoles & PC [...]
[ Source: Chit Hot ]
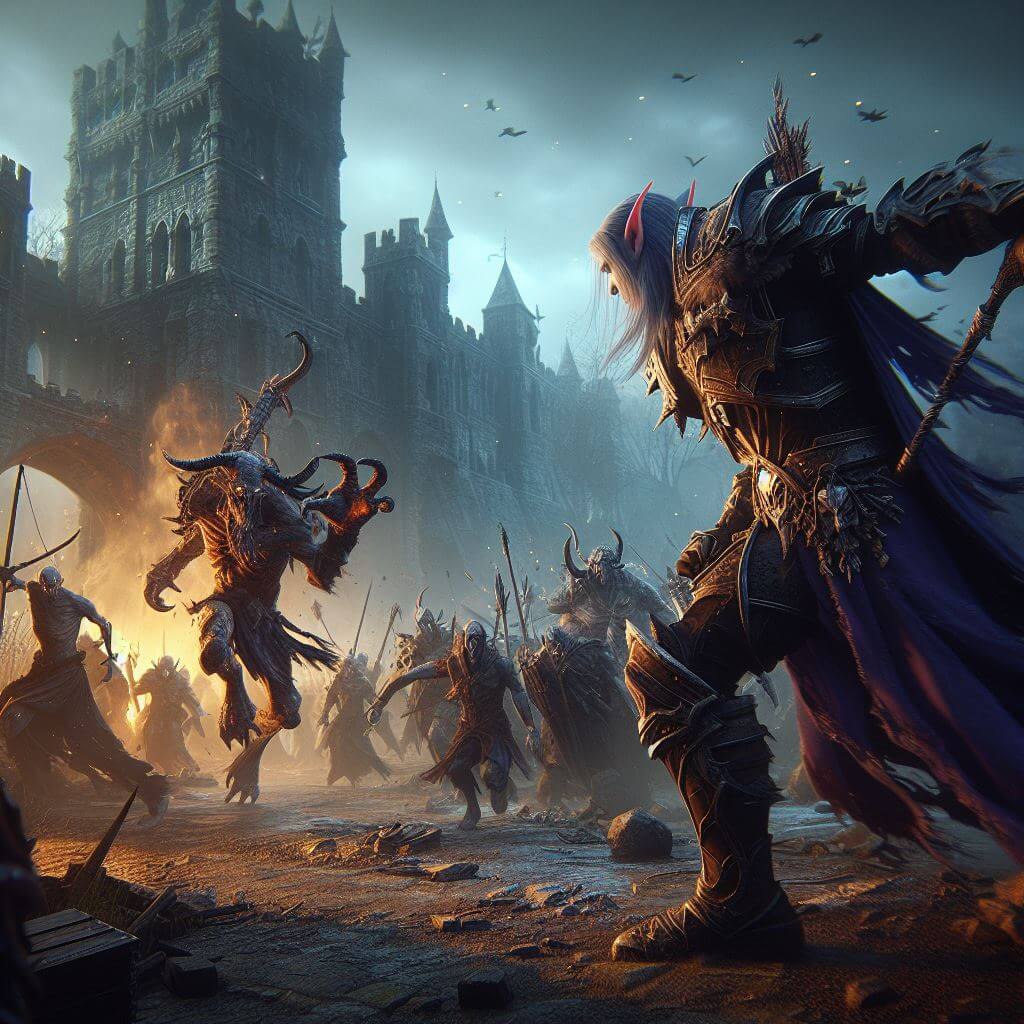
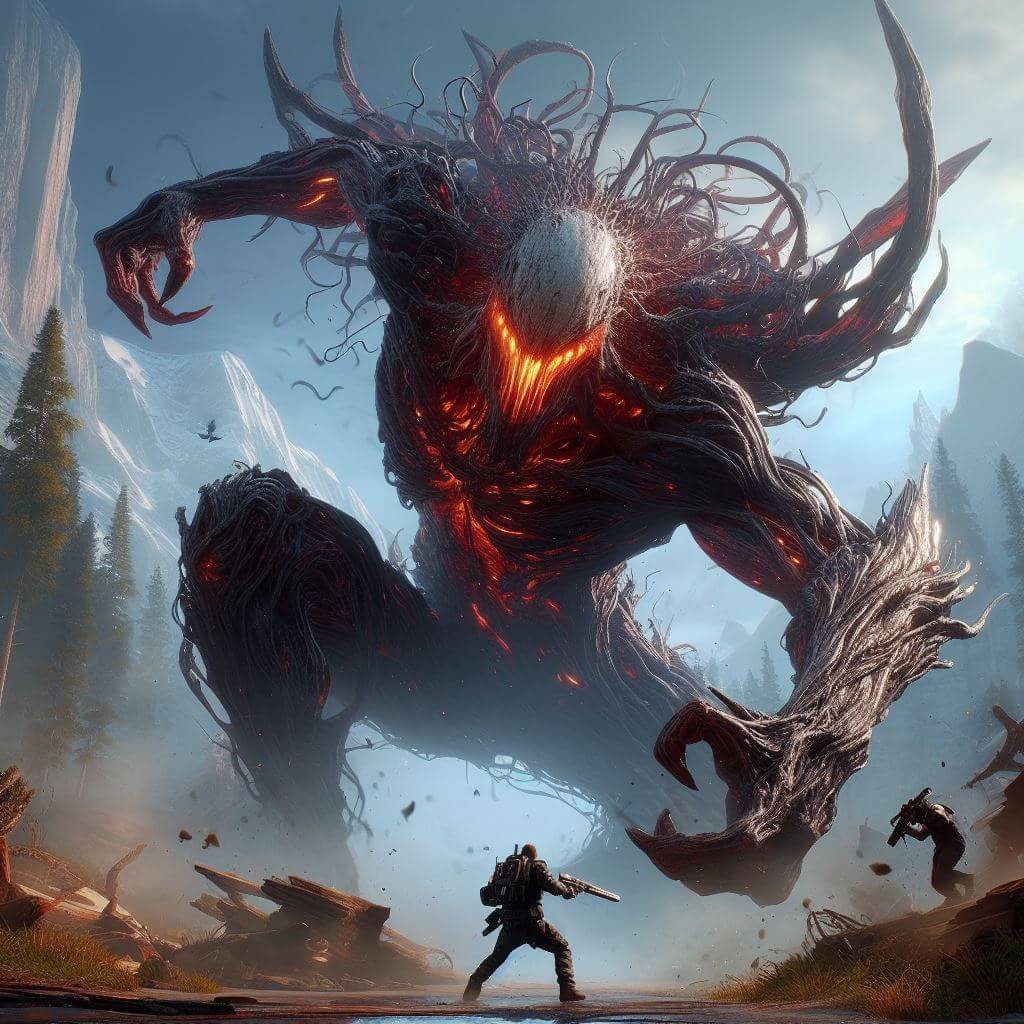
 Firesky Is A Demon-Slaying ARPG With A Raid: Shadow Legends-Like Vibe [...]
[ Source: Droid Gamers ]
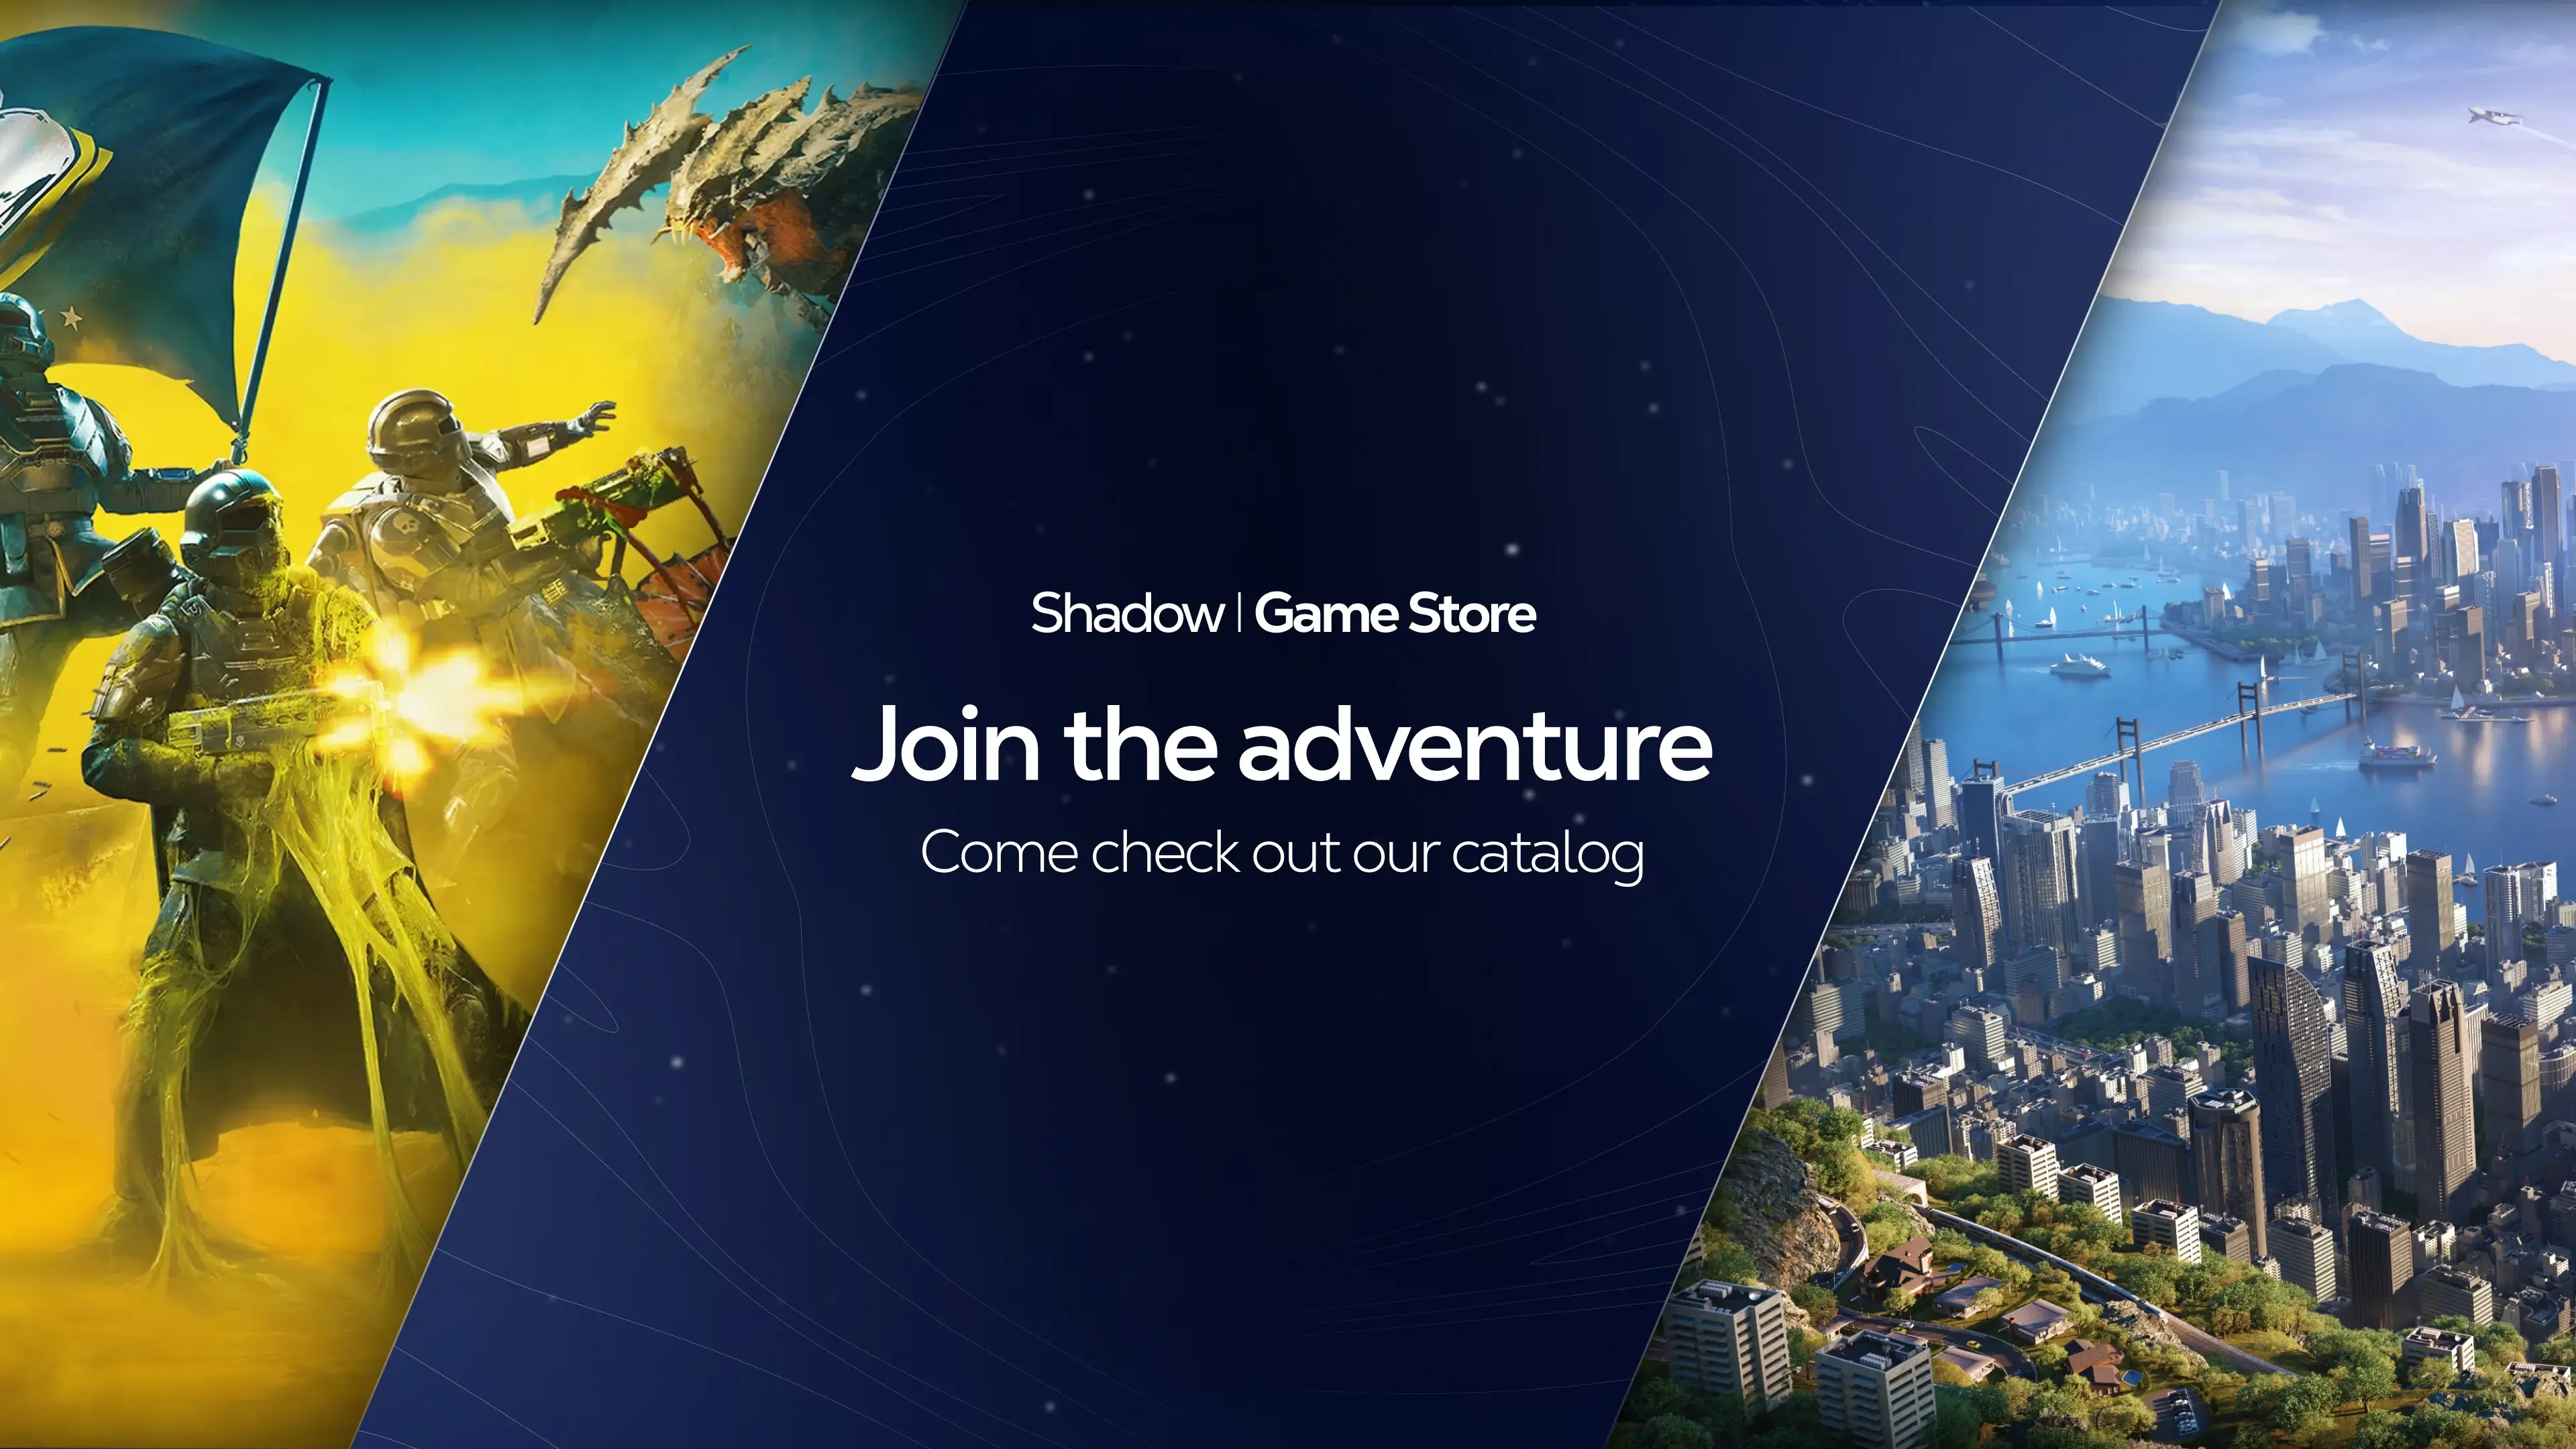 Shadow PC Launches The ‘Shadow Game Store’ [...]
[ Source: Cloud Dosage ]
 Forza Motorsport Update 7 reduces file size by 25GB while adding new content [...]
[ Source: Destructoid ]
 After 26 years stuck in Japan, Nintendo finally releases forgotten SNES Mario worldwide on Switch [...]
[ Source: GamesRadar+ ]
TL;DR Gaming News Today
ByteRockers' Games - Beat Slayer: Epic Music. Legendary Weapons. Nasty Robots.
New Demo available on Steam! Feel the music and turn nasty robots into metal scrap!
[ Source: GameTikker ]
 Grind - A first person shooter for Amiga 500, made with the amazing Dread-Engine [...]
[ Source: Indie Retro News ]
 CD Projekt interested in multiplayer components, but insists single-player games are still king [...]
[ Source: Game Developer ]
 REMNANT II DLC The Forgotten Kingdom Launches April 23 [...]
[ Source: But Why Tho? ]